Business LinkedIn Insights

What type of content should companies share on LinkedIn? More photos or videos? High-value whitepapers or bite-sized infographics? We analysed 157 LinkedIn business profiles of Swiss companies across industries like Transport & Logistics, Food & Beverage, Retail, Construction & Infrastructure, Manufacturing, Real Estate, Hospitality, Technology, Agriculture & Environment, and Finance. Our dataset includes 14,268 posts, 5,402 images, and 3,105 videos from all of 2024.
Comparability: More Followers Mean Lower Engagement
We access publicly available profile data: followers, interactions, posts, etc. This is why we use Engagement Rate (ER) as a metric for content performance. For example, we cannot measure the actual reach of a video. However, in various analyses, we have observed that ER correlates with reach and can therefore be used as an indicator of “good” content.
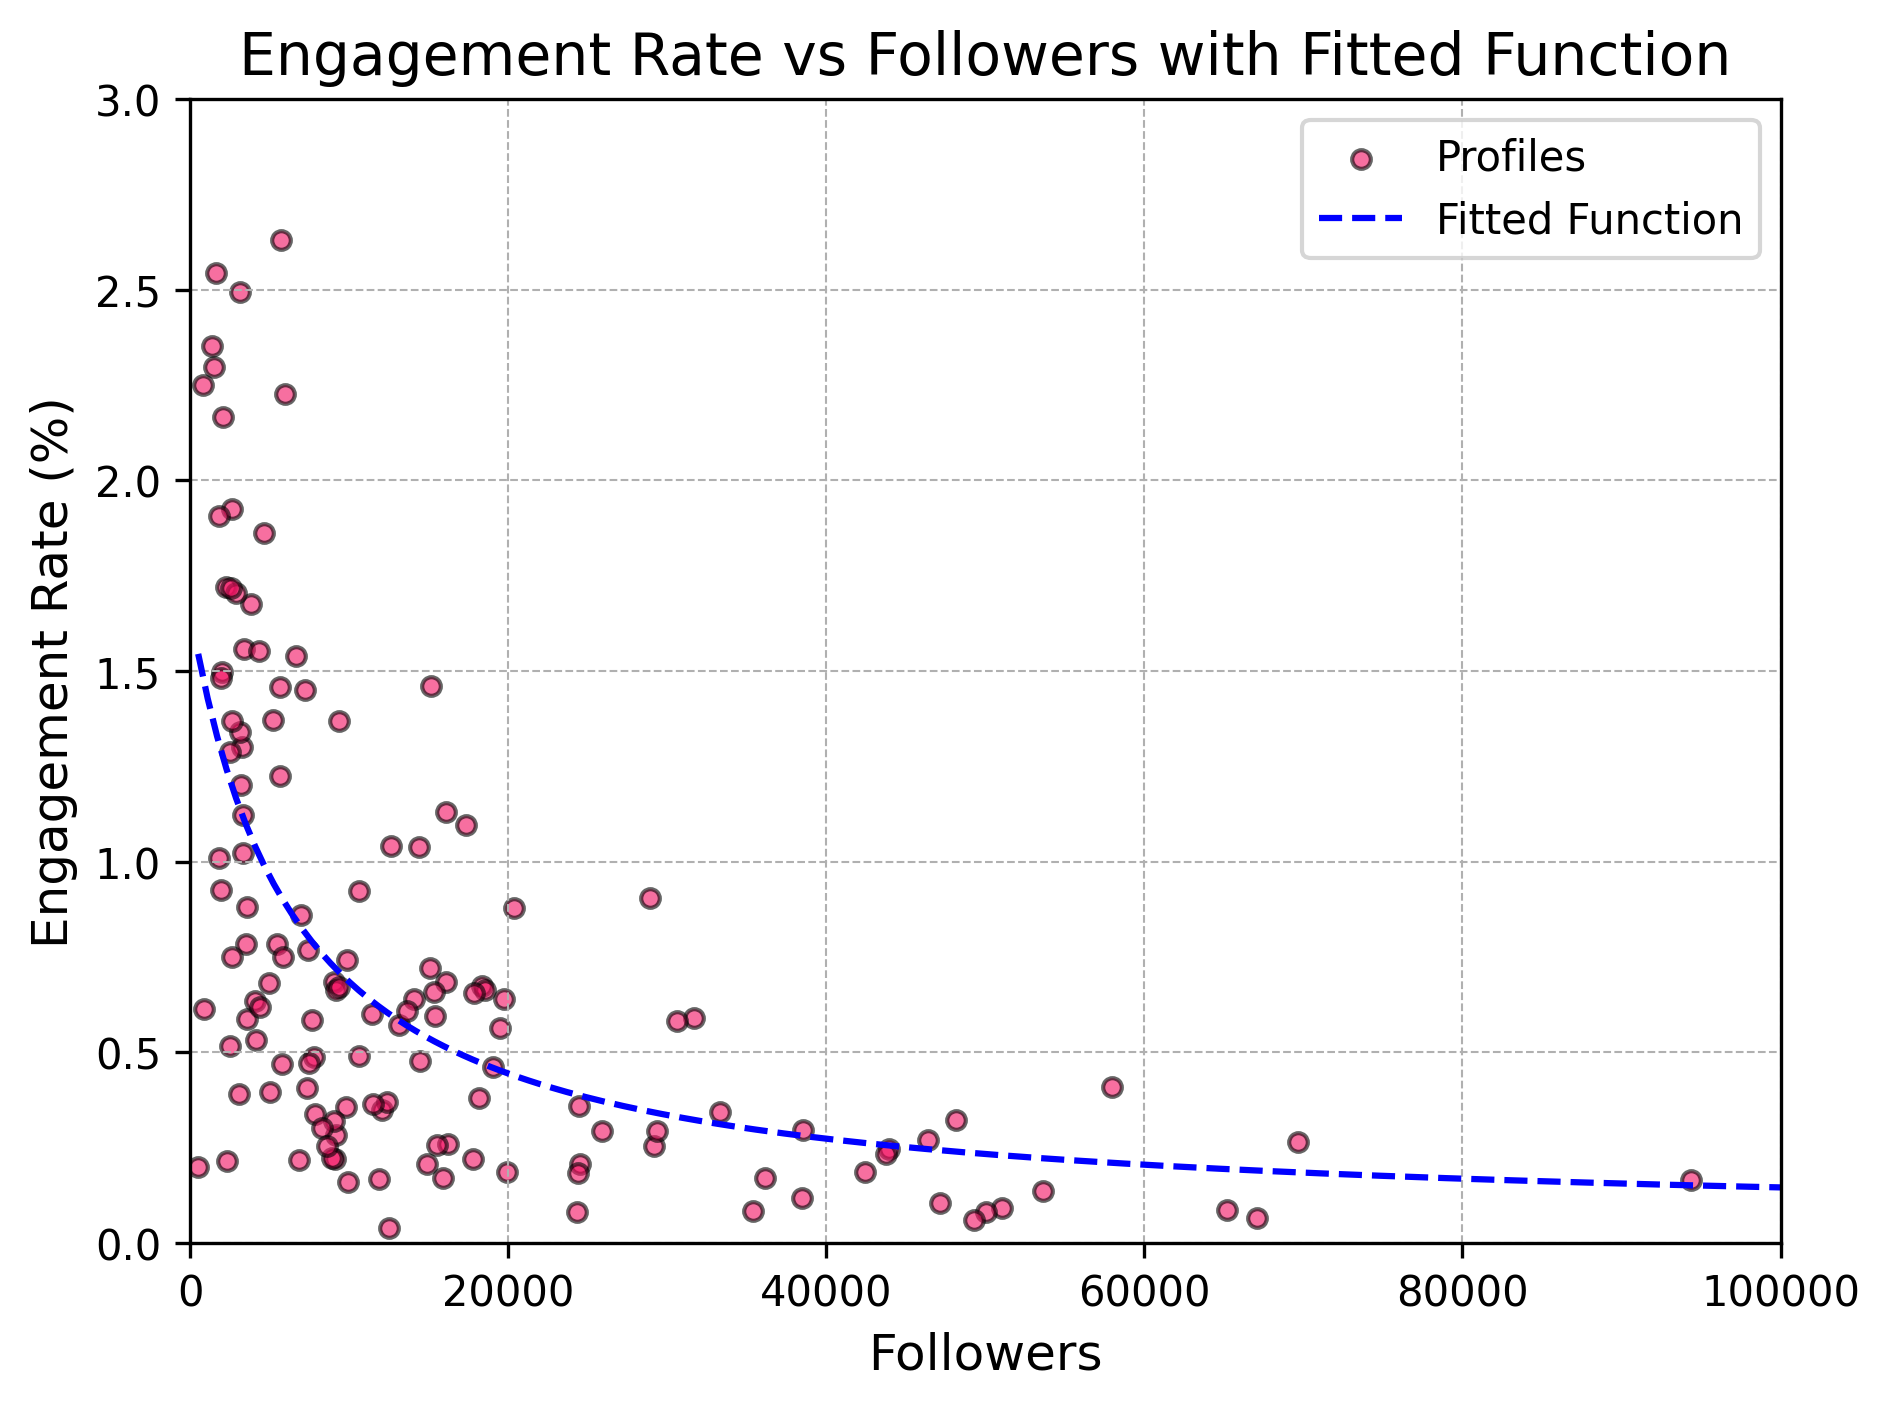
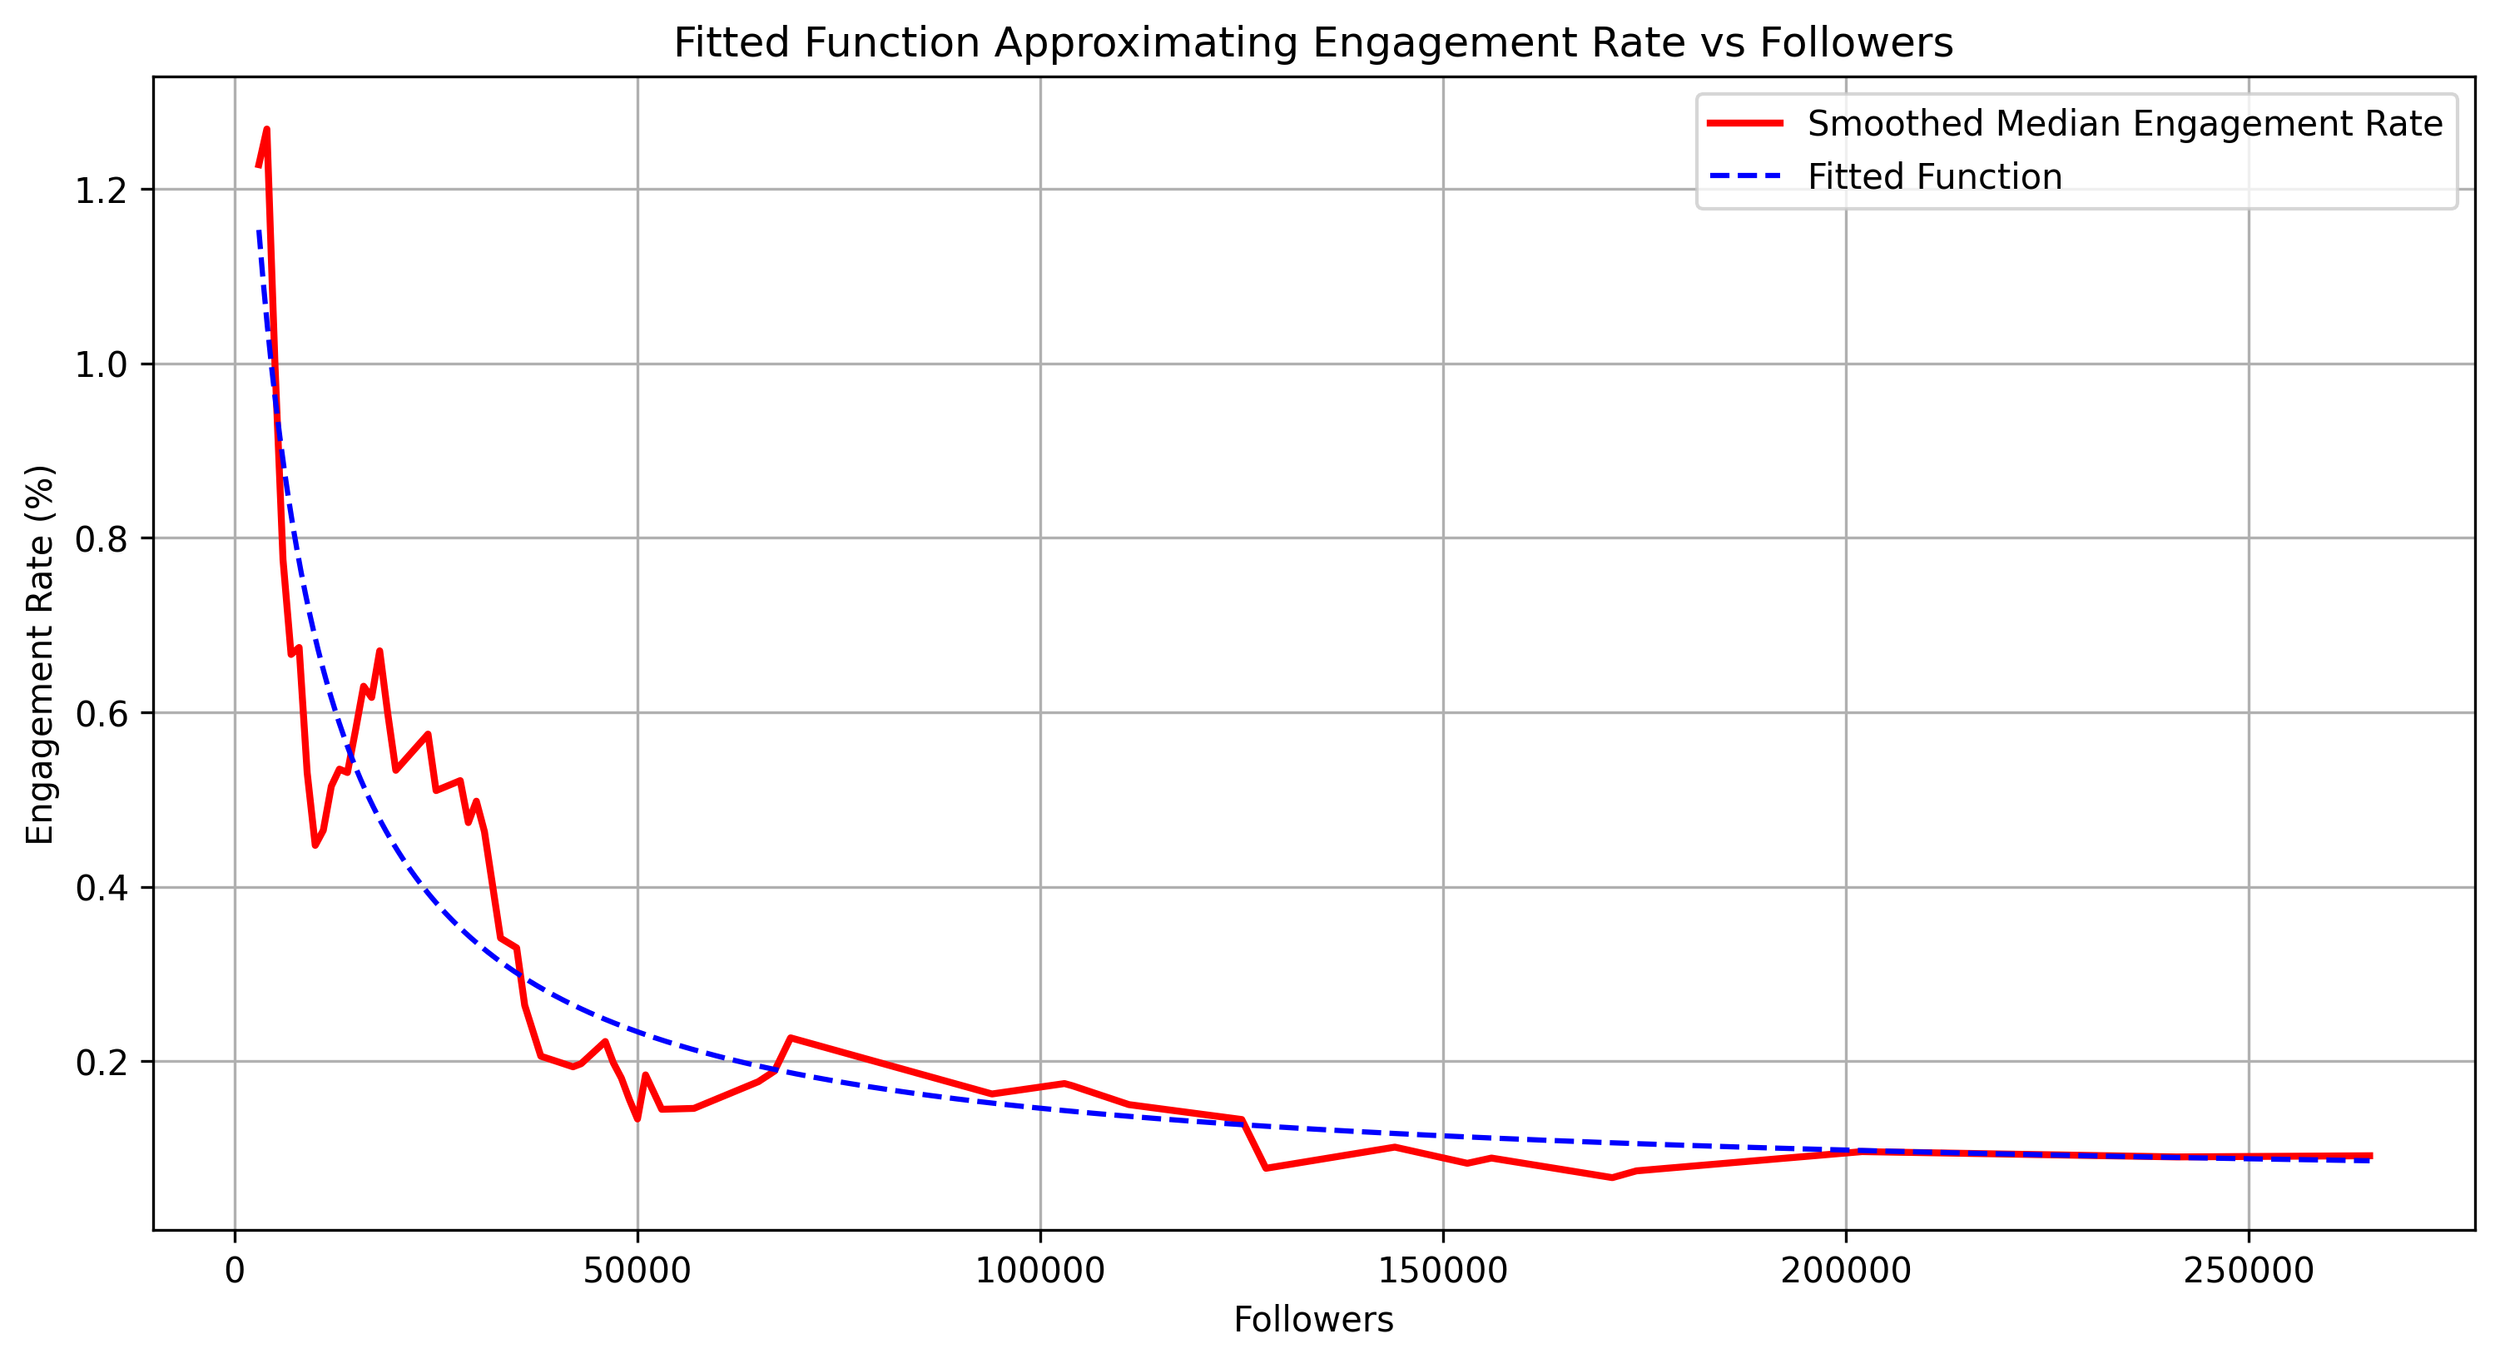
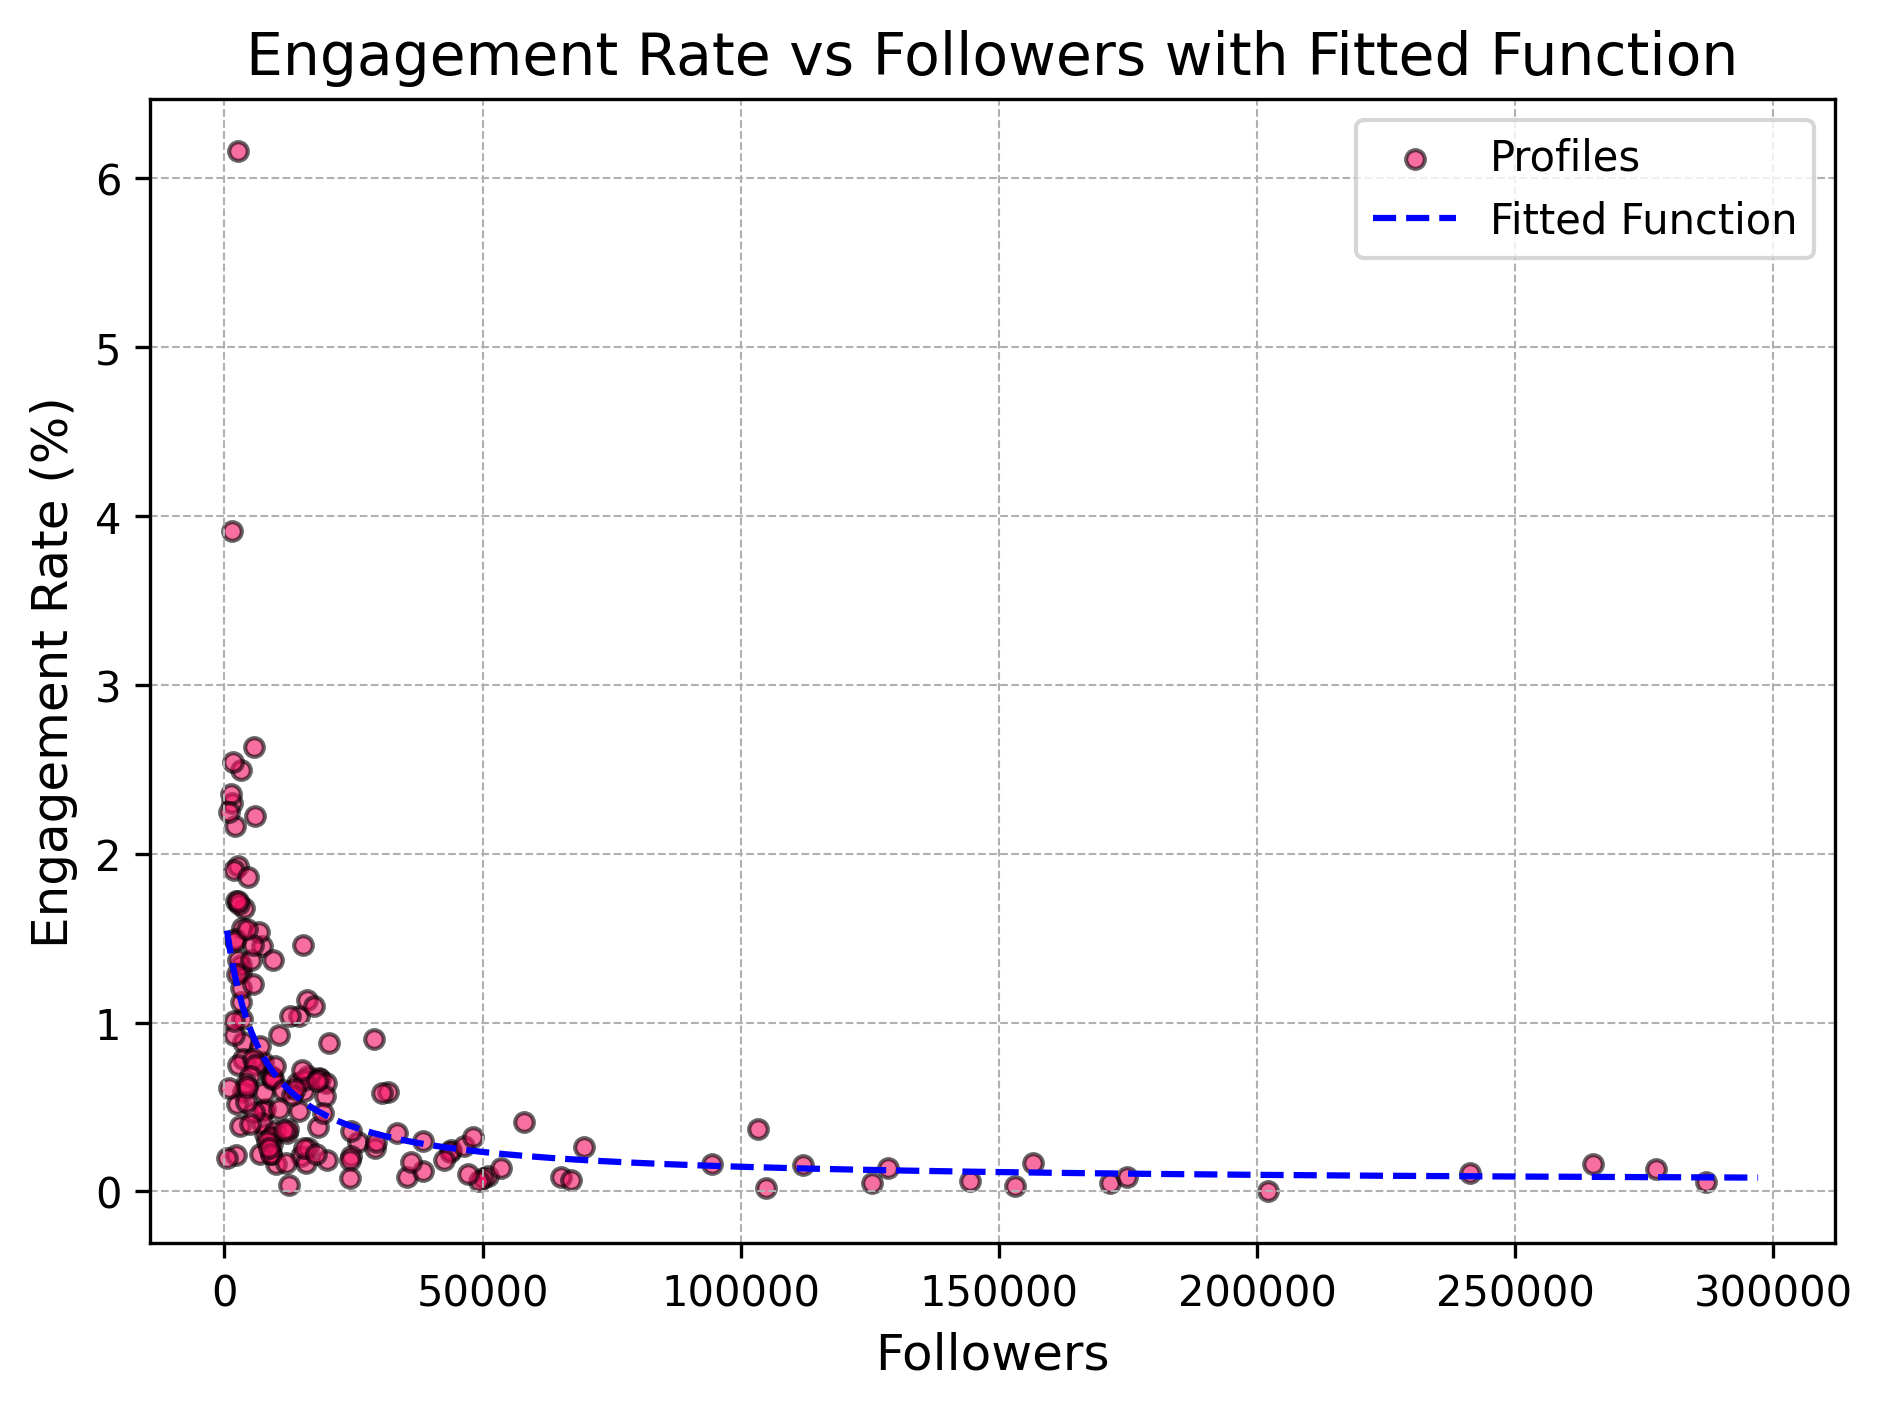
Engagement Rate is heavily influenced by the number of followers. The more followers, the lower the Engagement Rate. Individual accounts with an extremely high number of followers or fewer than 1,000 distorted the overall picture too much and were therefore excluded from the analysis.
To compare LinkedIn profiles, we use the deviation from the median Engagement Rate within a specific follower range. Successful profiles are above the median, while unsuccessful ones are below it.
Fundamentals
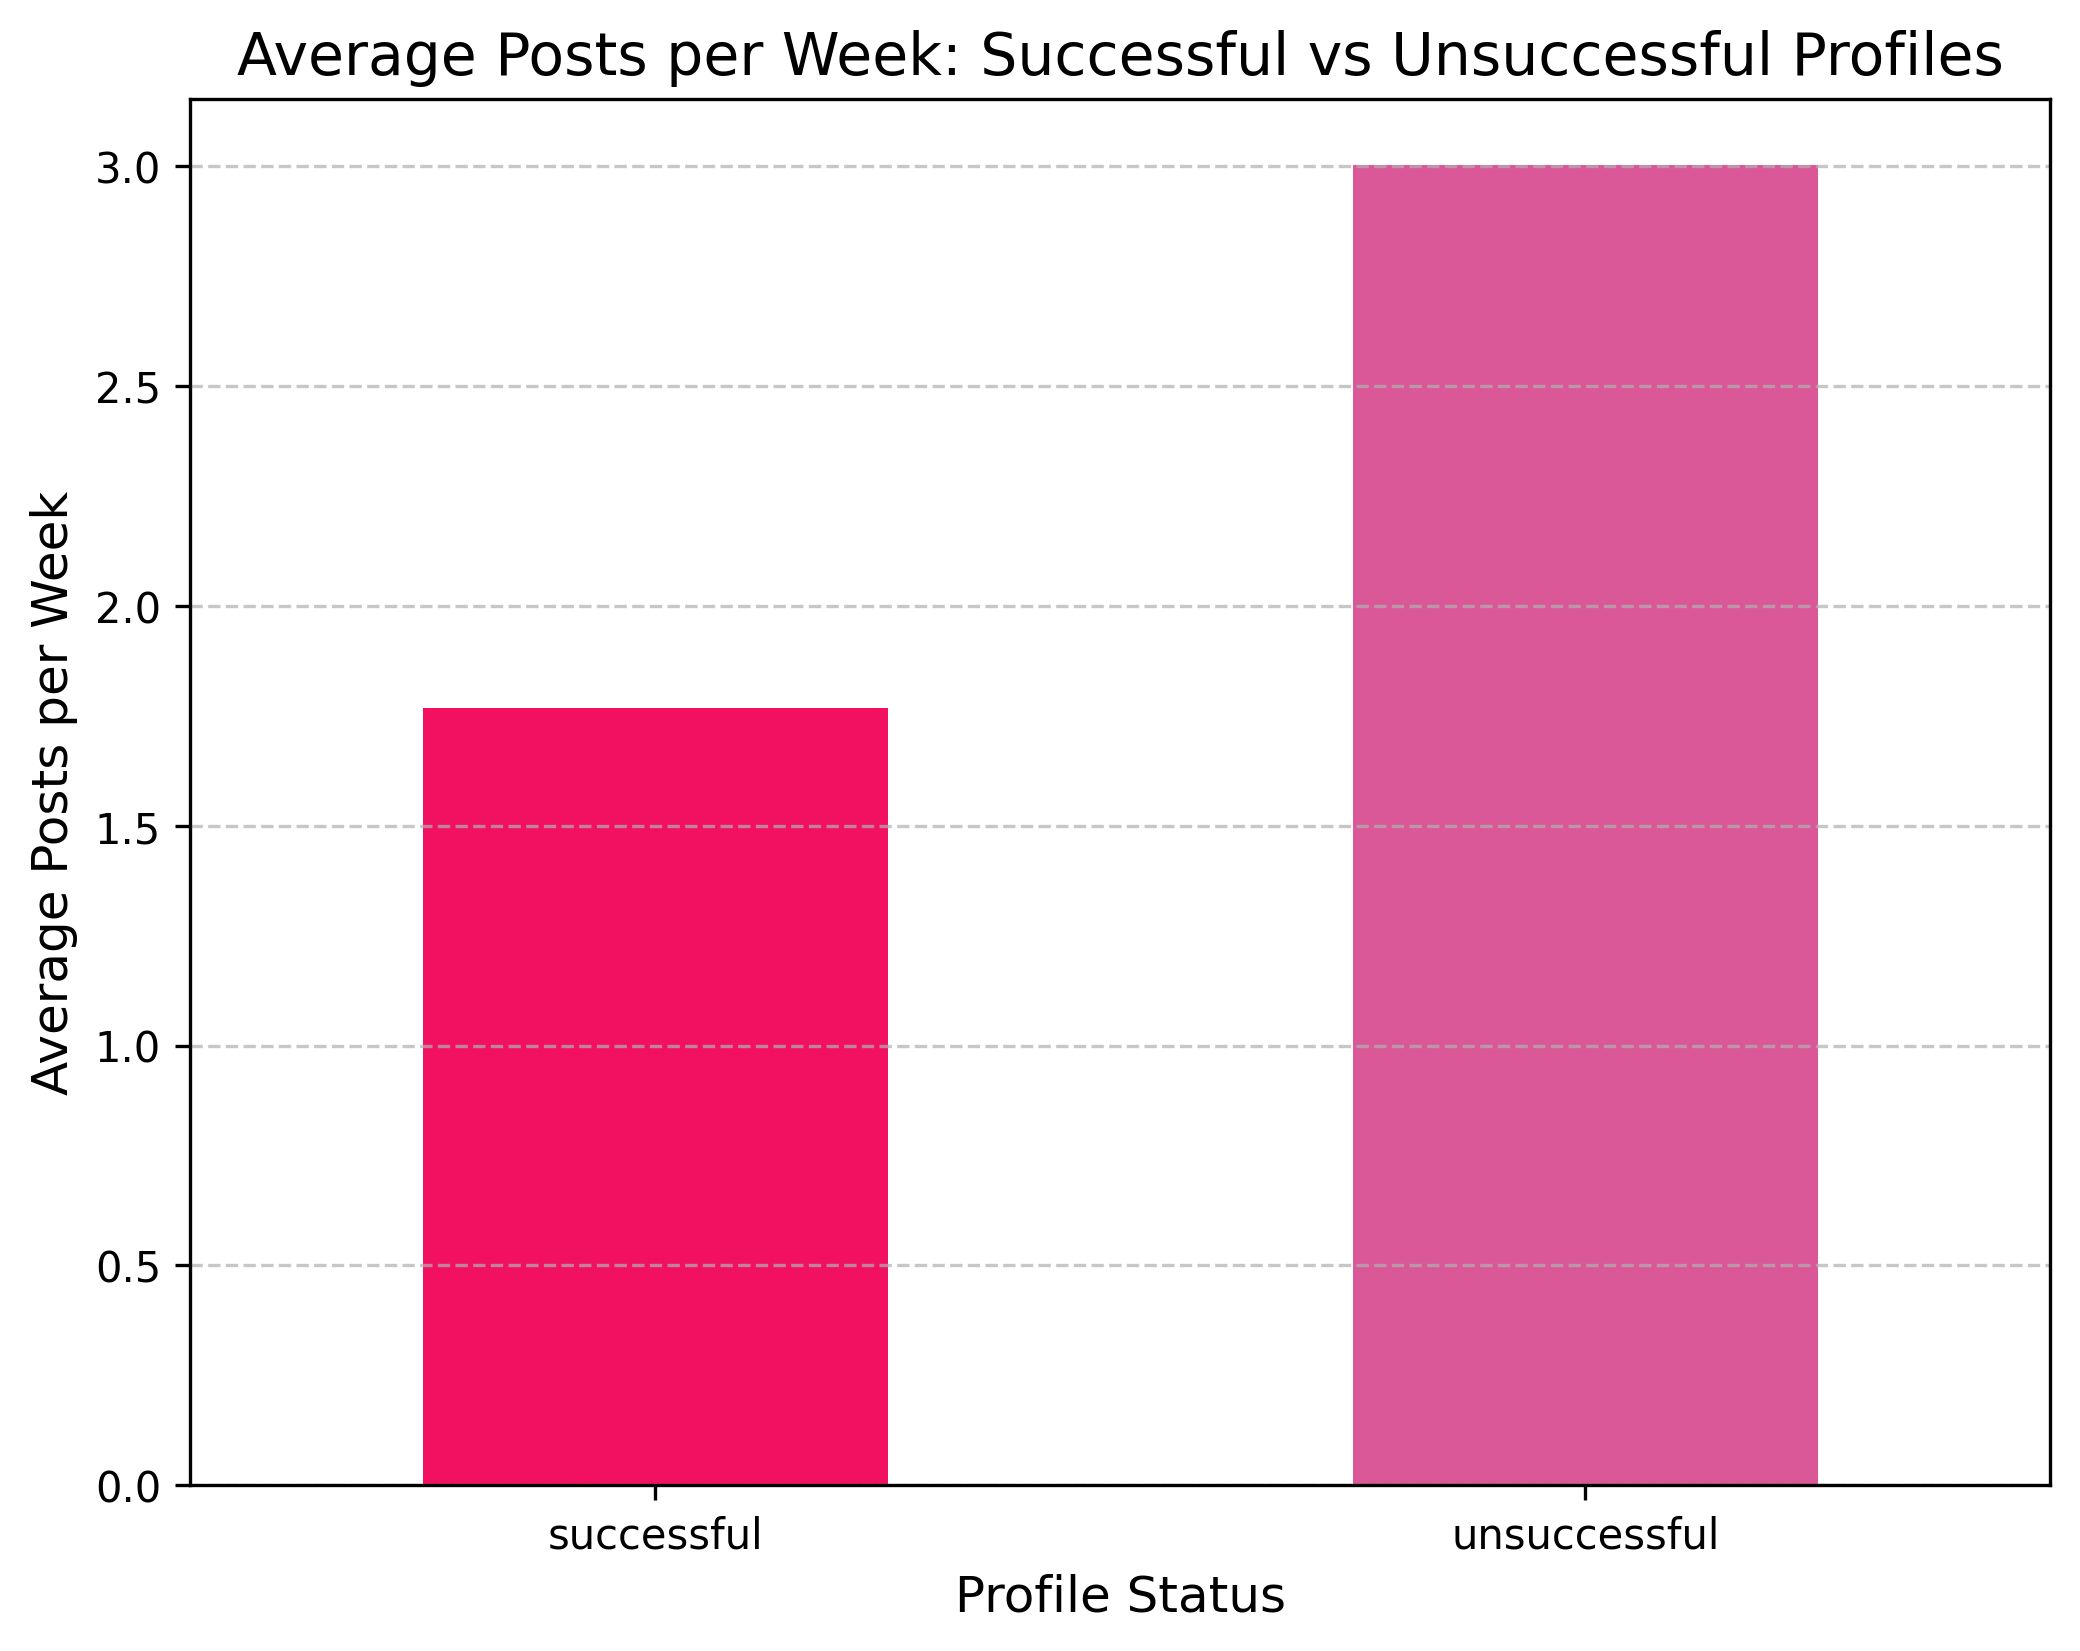
Successful accounts have an Engagement Rate 5–6 times higher than others. Compared to less successful accounts, they post less frequently per week but tend to write slightly longer texts:

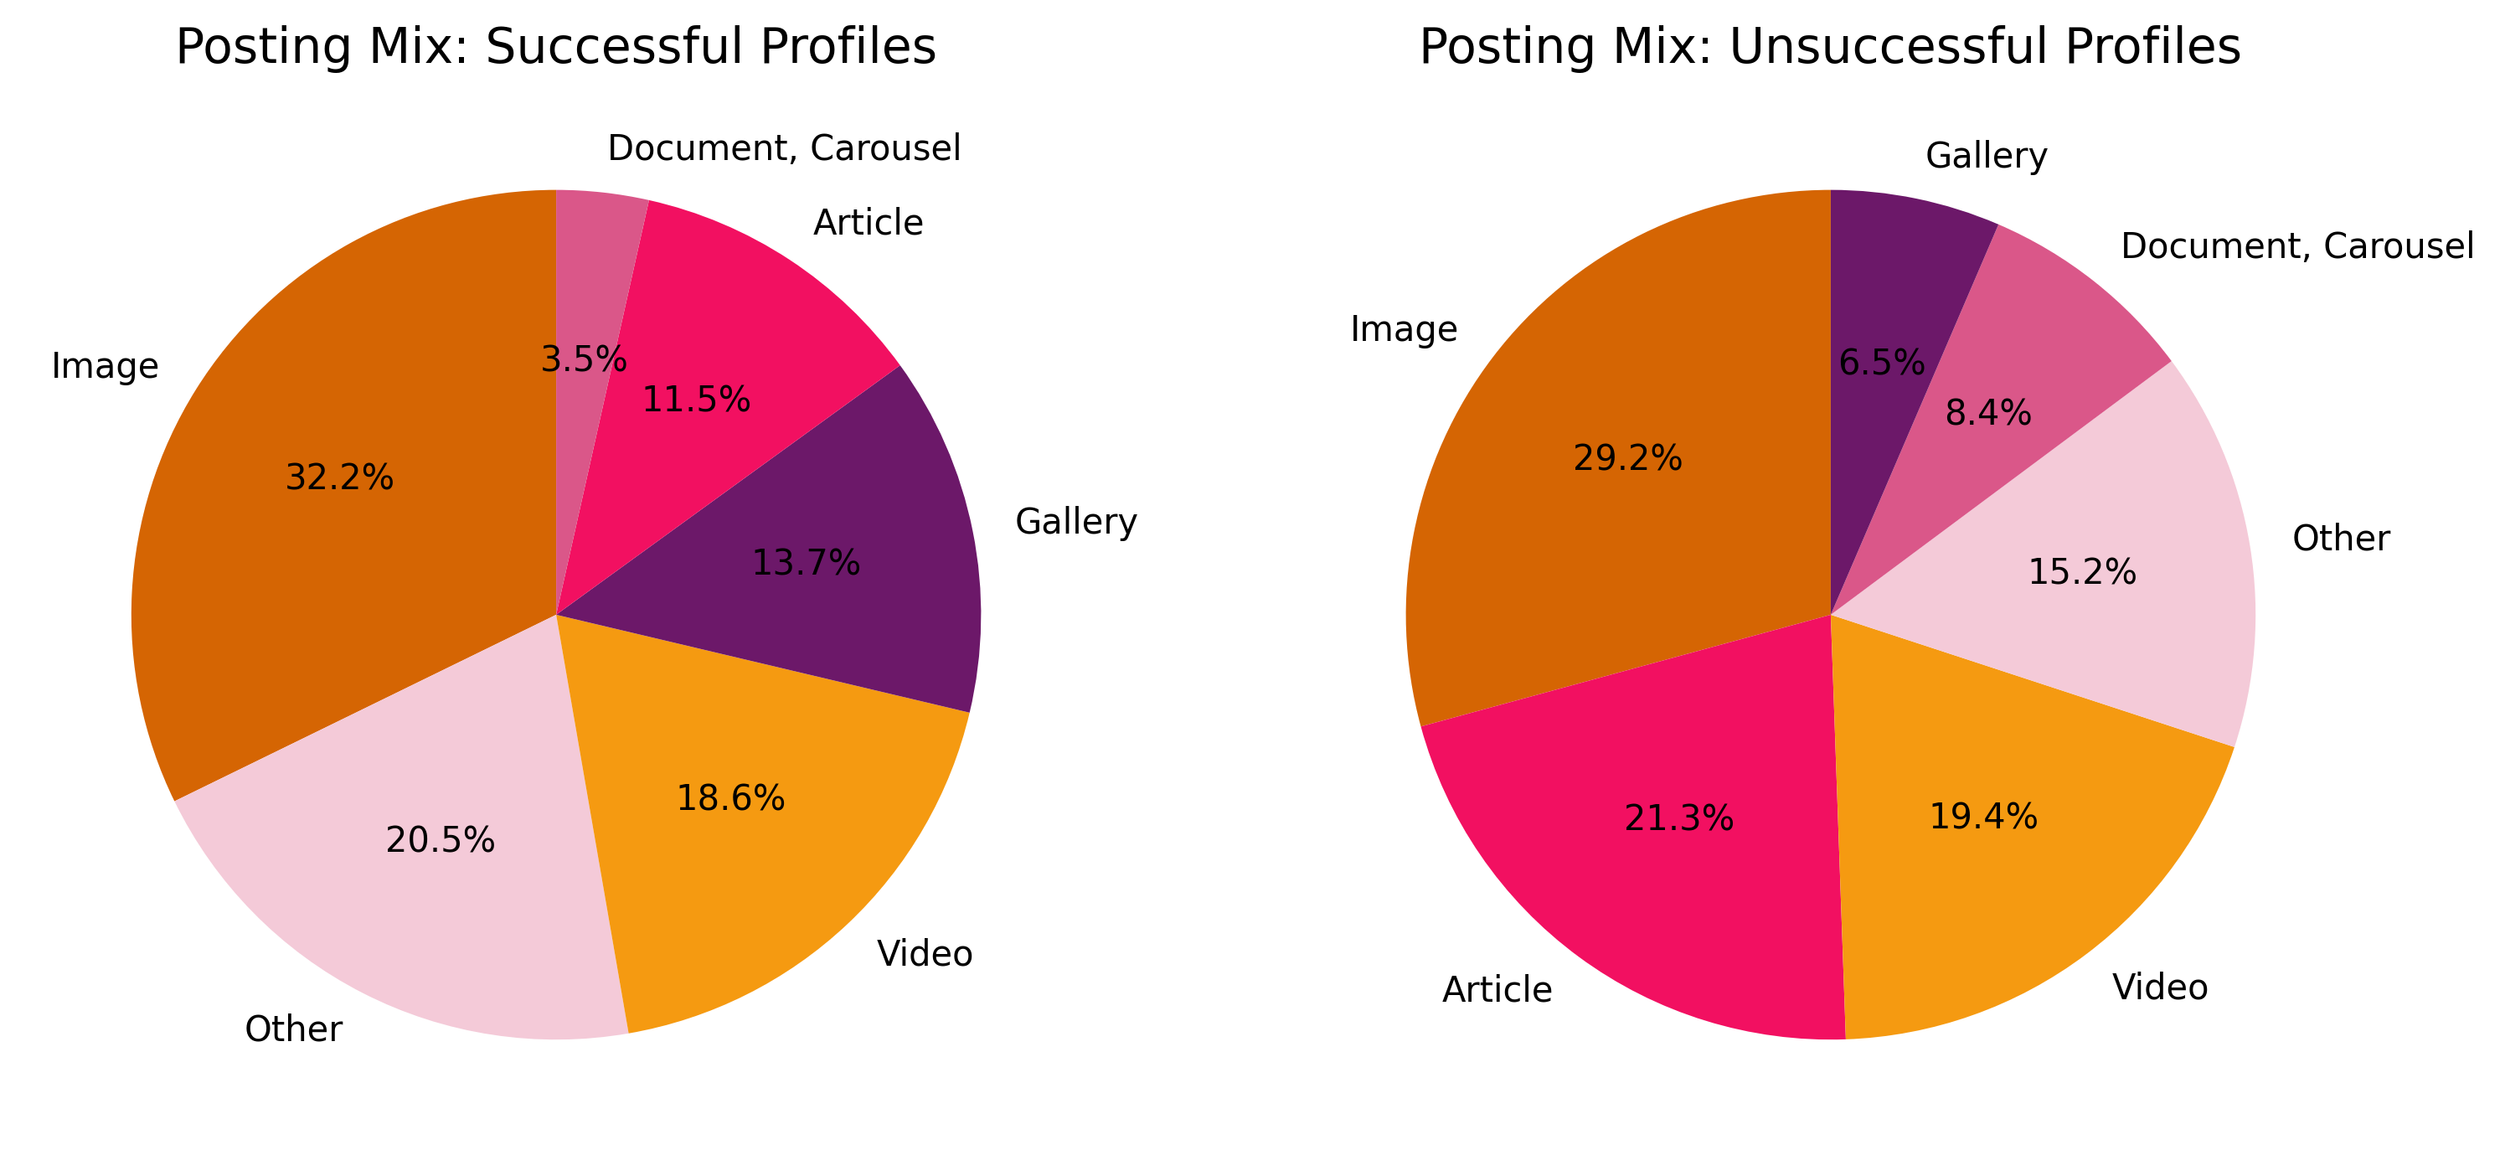
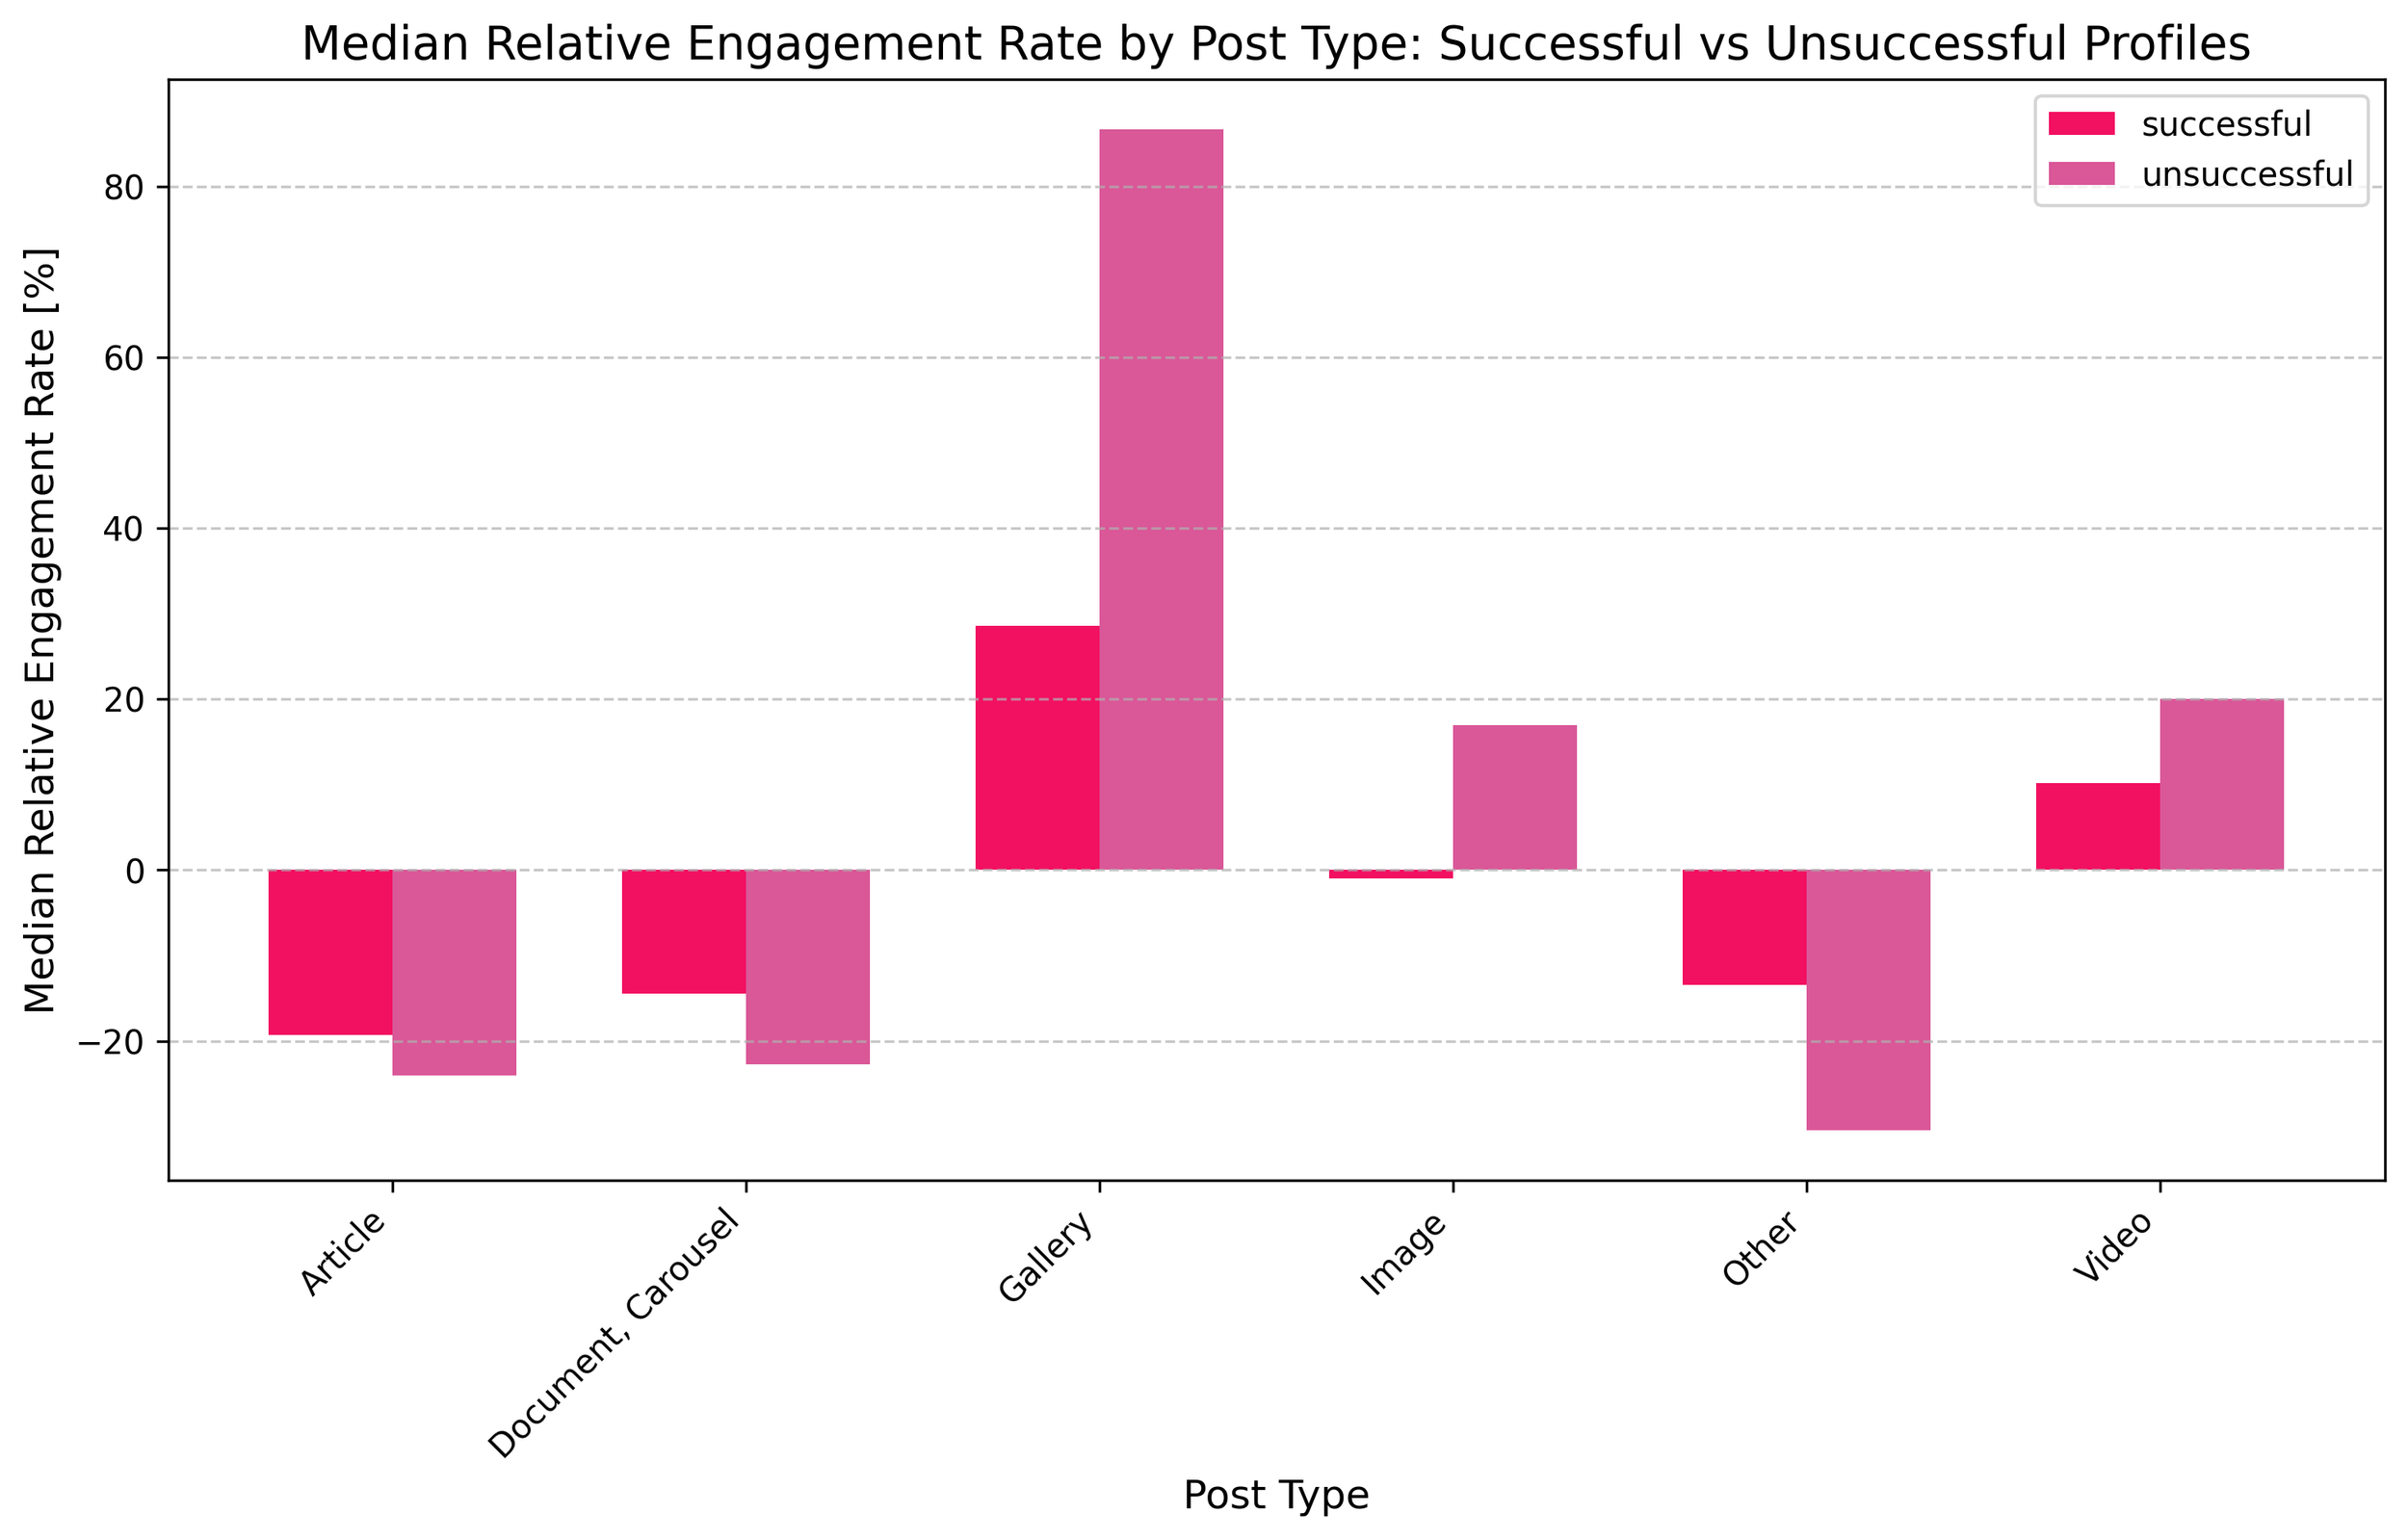
Successful LinkedIn accounts publish fewer articles and documents but significantly more image galleries, as well as slightly fewer videos. It’s worth noting that even among underperforming accounts, gallery posts help maintain engagement rates. Articles, PDFs, and reshares (Others) negatively impact engagement, while images and videos have a slightly positive effect.
When do posts go live? Mostly in the second half of the week – typically in the morning. However, disproportionately high engagement occurs in the evening.


Industries such as Transport & Logistics, Food & Beverage, Retail, Construction & Infrastructure, and Manufacturing tend to have above-average engagement rates. In contrast, Real Estate, Hospitality, Technology, Agriculture & Environment, and Finance perform below average. The following companies/organisations stood out with particularly strong engagement:


Upon request, we can also create specific industry reports for you.
What 14,268 text posts tell us: longer – and unfortunately less substantial – performs better.
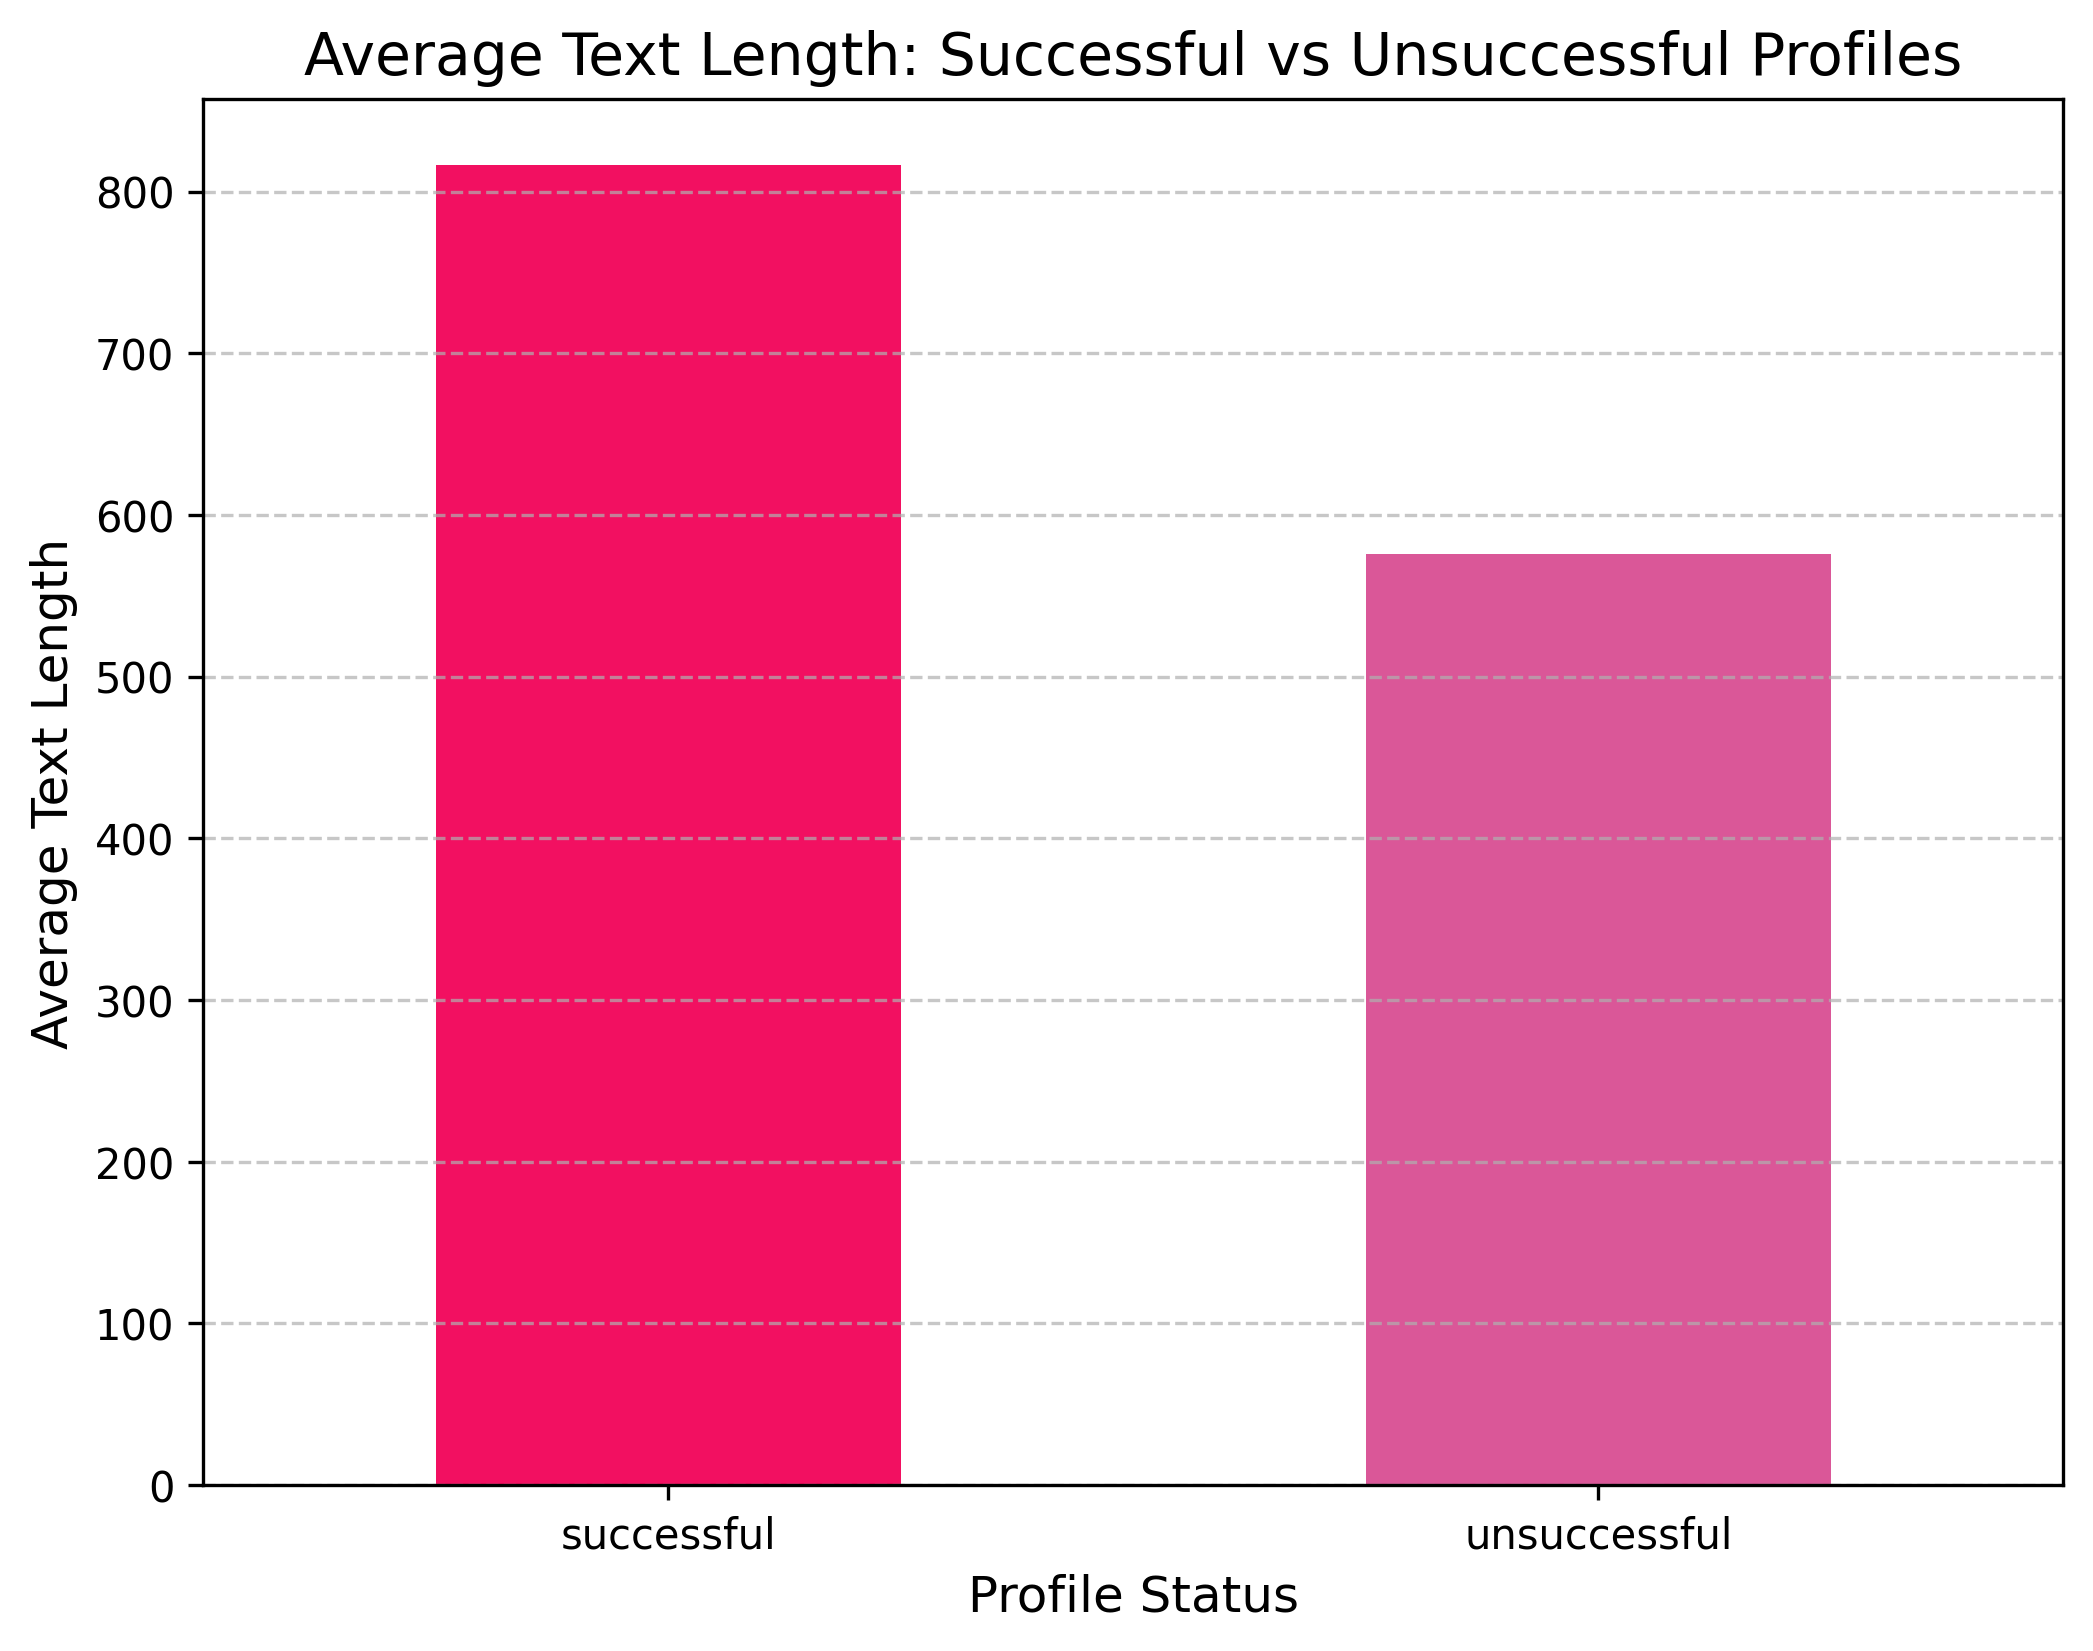

Successful profiles, on average, have longer texts than less successful ones.
Both negative (most strongly) and positive posts boost engagement, while neutral posts decrease it.
Customer education, thought leadership, recruitment, and marketing posts perform poorly. General brand awareness posts, however, do better.
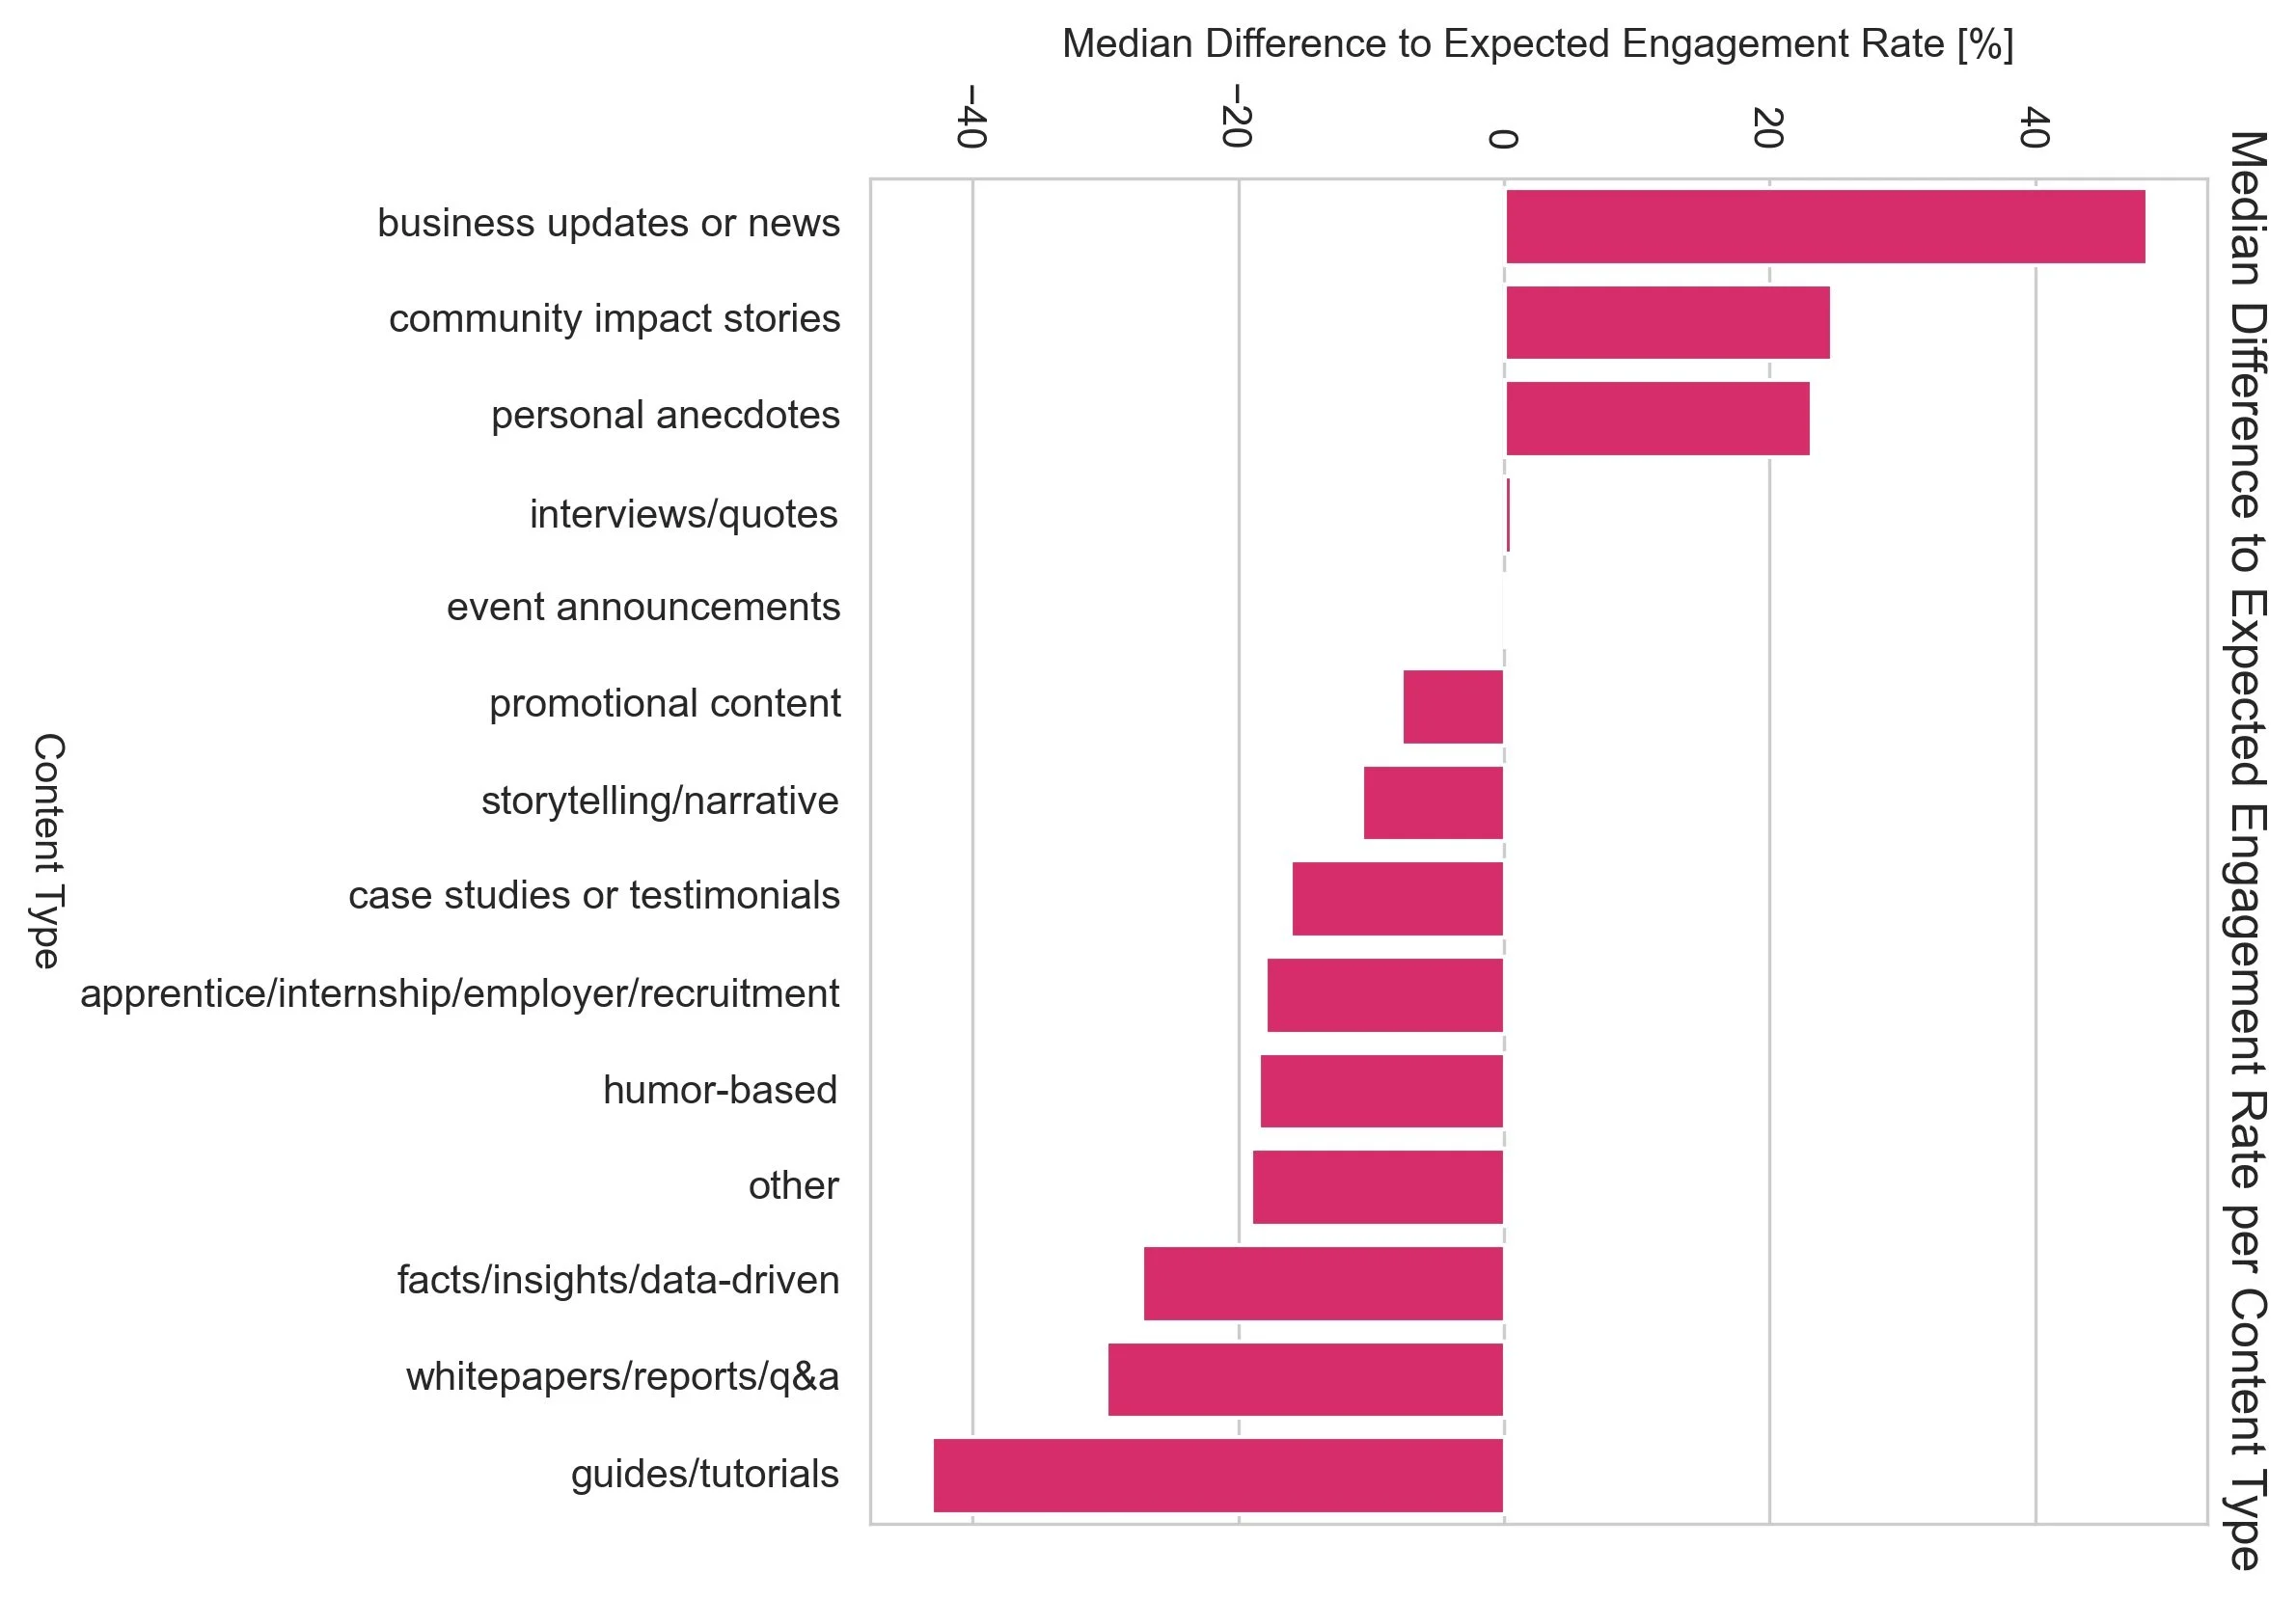
Business updates, community impact stories, and personal anecdotes stand out the most. Guides, facts, and whitepapers – unfortunately – perform below average.
Calls to action like "Comment," "Apply," "Sign up," and similar prompts hurt engagement. No CTA at all works best. The only exception? "Schedule a meeting"—which showed a positive effect.
Insights from 5,402 image and gallery posts


People have a highly positive impact on Engagement Rate (ER), with infographics being the only format that significantly lowers engagement. One-third of all images feature people. Unfortunately, a quarter of posts focus on products and services, which tend to perform poorly.
Photos with three or more people perform better, with group photos of over 20 people achieving the best results. However, around 60% of photos contain no people or just one person.
Images without any text overlay perform significantly better.
What 3,105 videos tell us
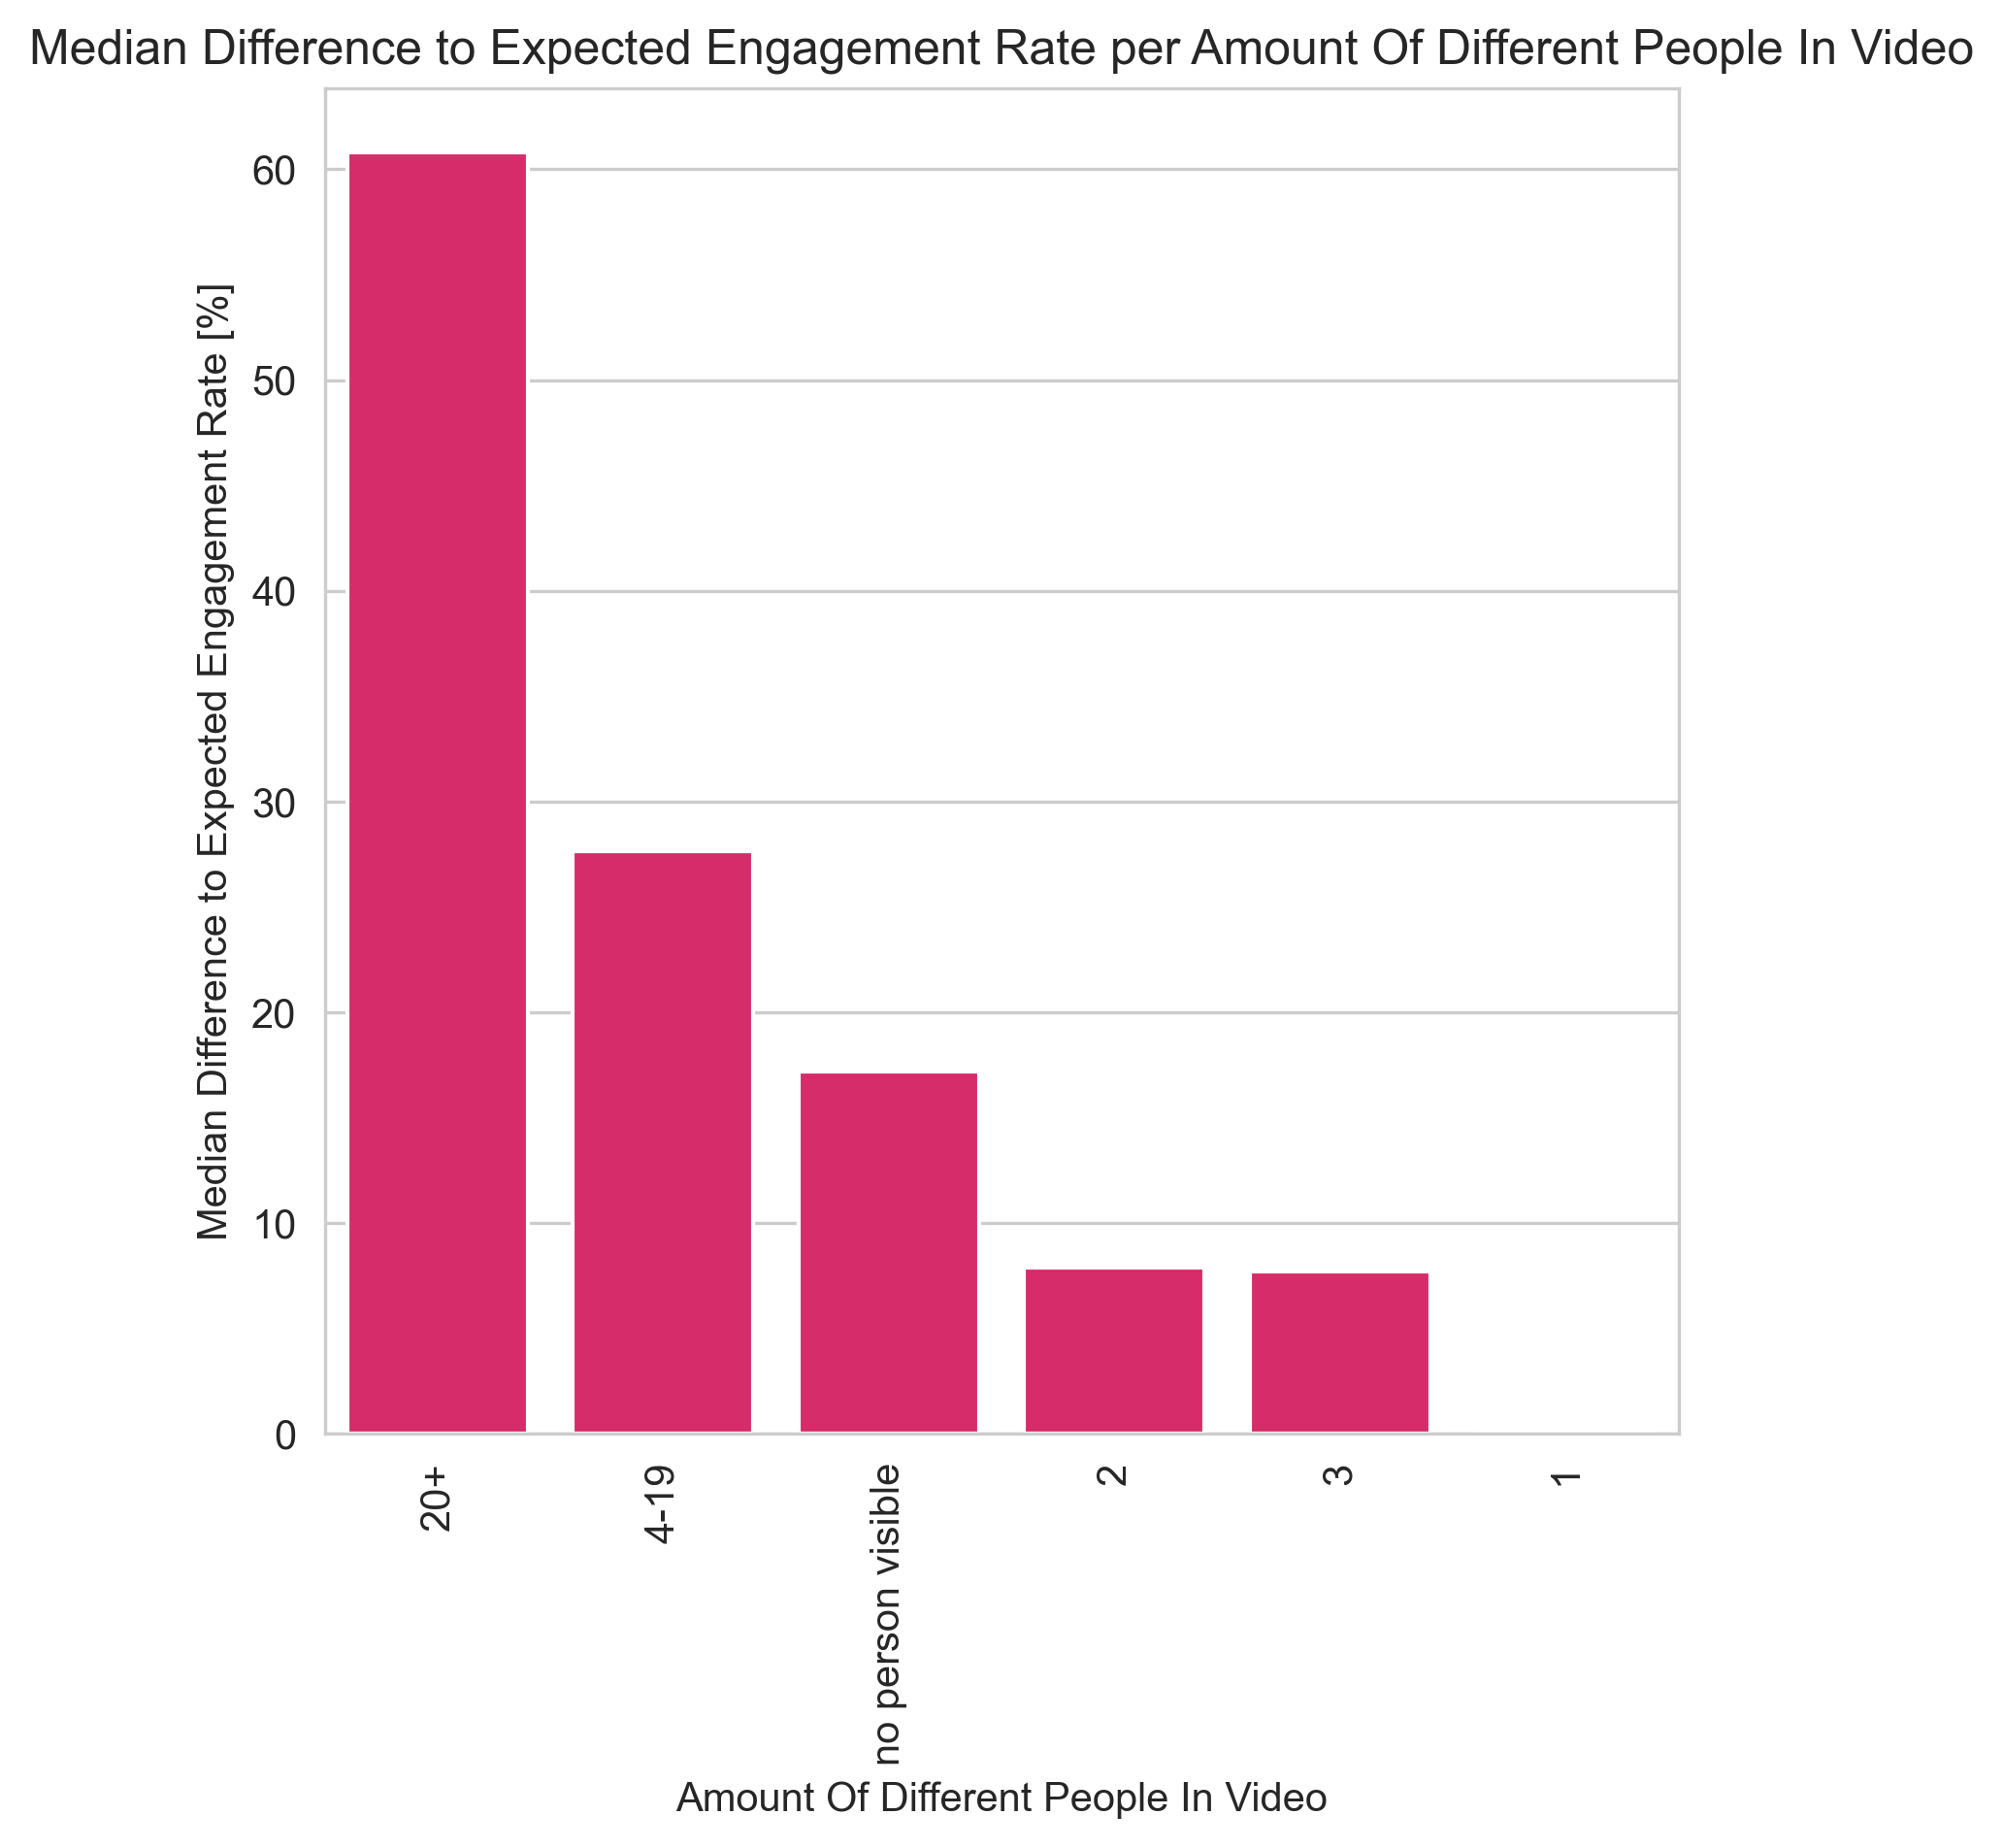
Again, videos featuring 4+ people perform best, with groups of 20+ achieving the highest engagement. However, around 60% of videos only feature 0–3 people.
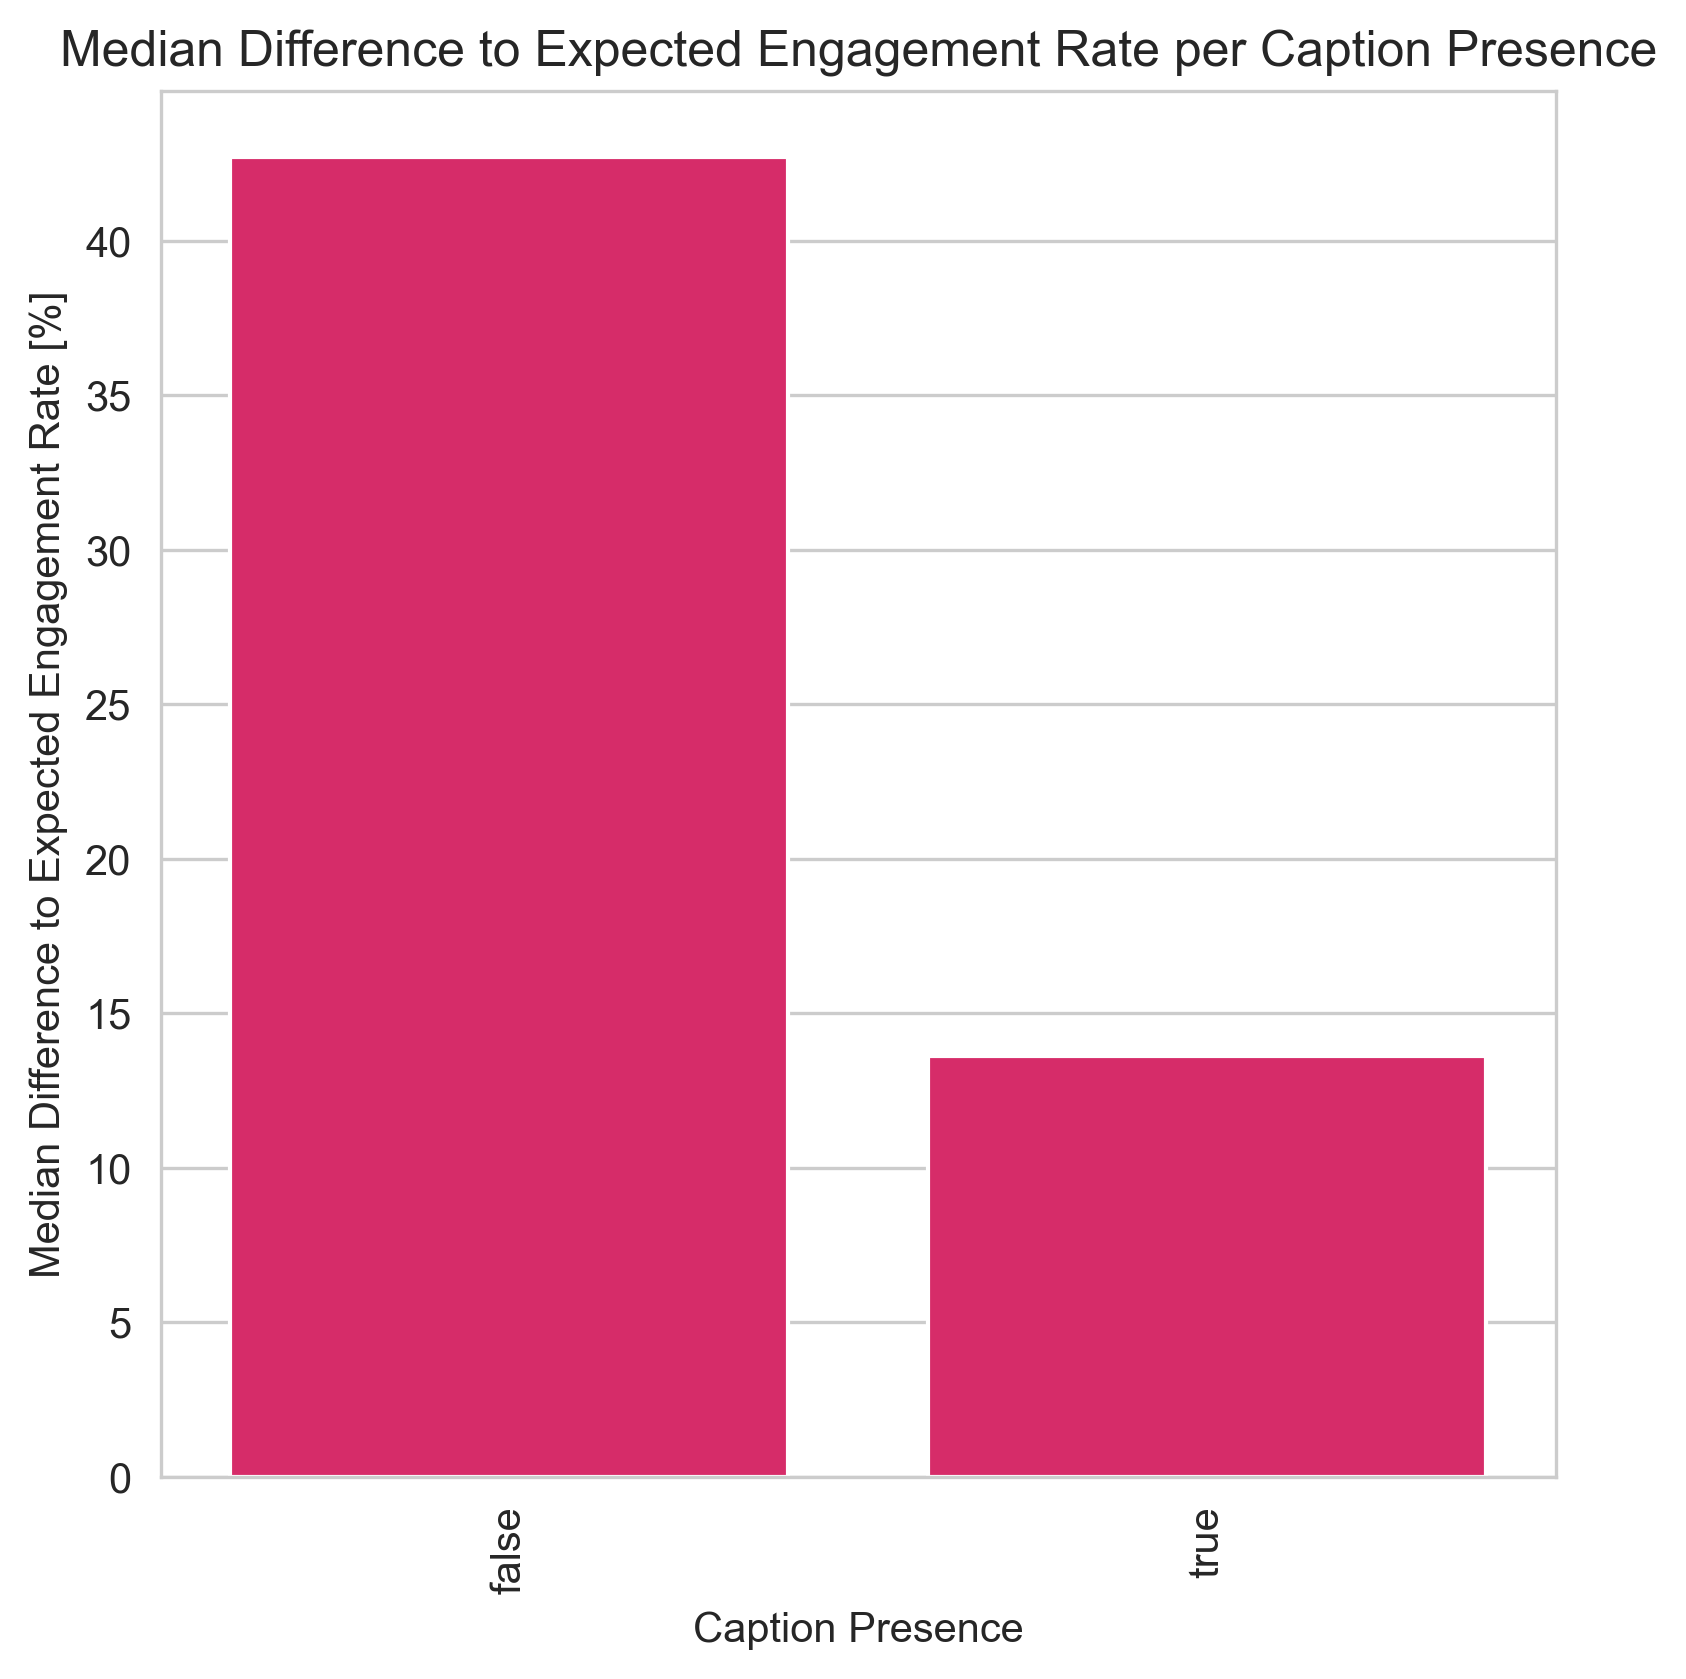
Videos without captions perform more than twice as well as those with captions. Yet, around 85% of video posts include captions! Captions should provide real added value—if not, it’s better to leave them out. Let the video speak for itself!
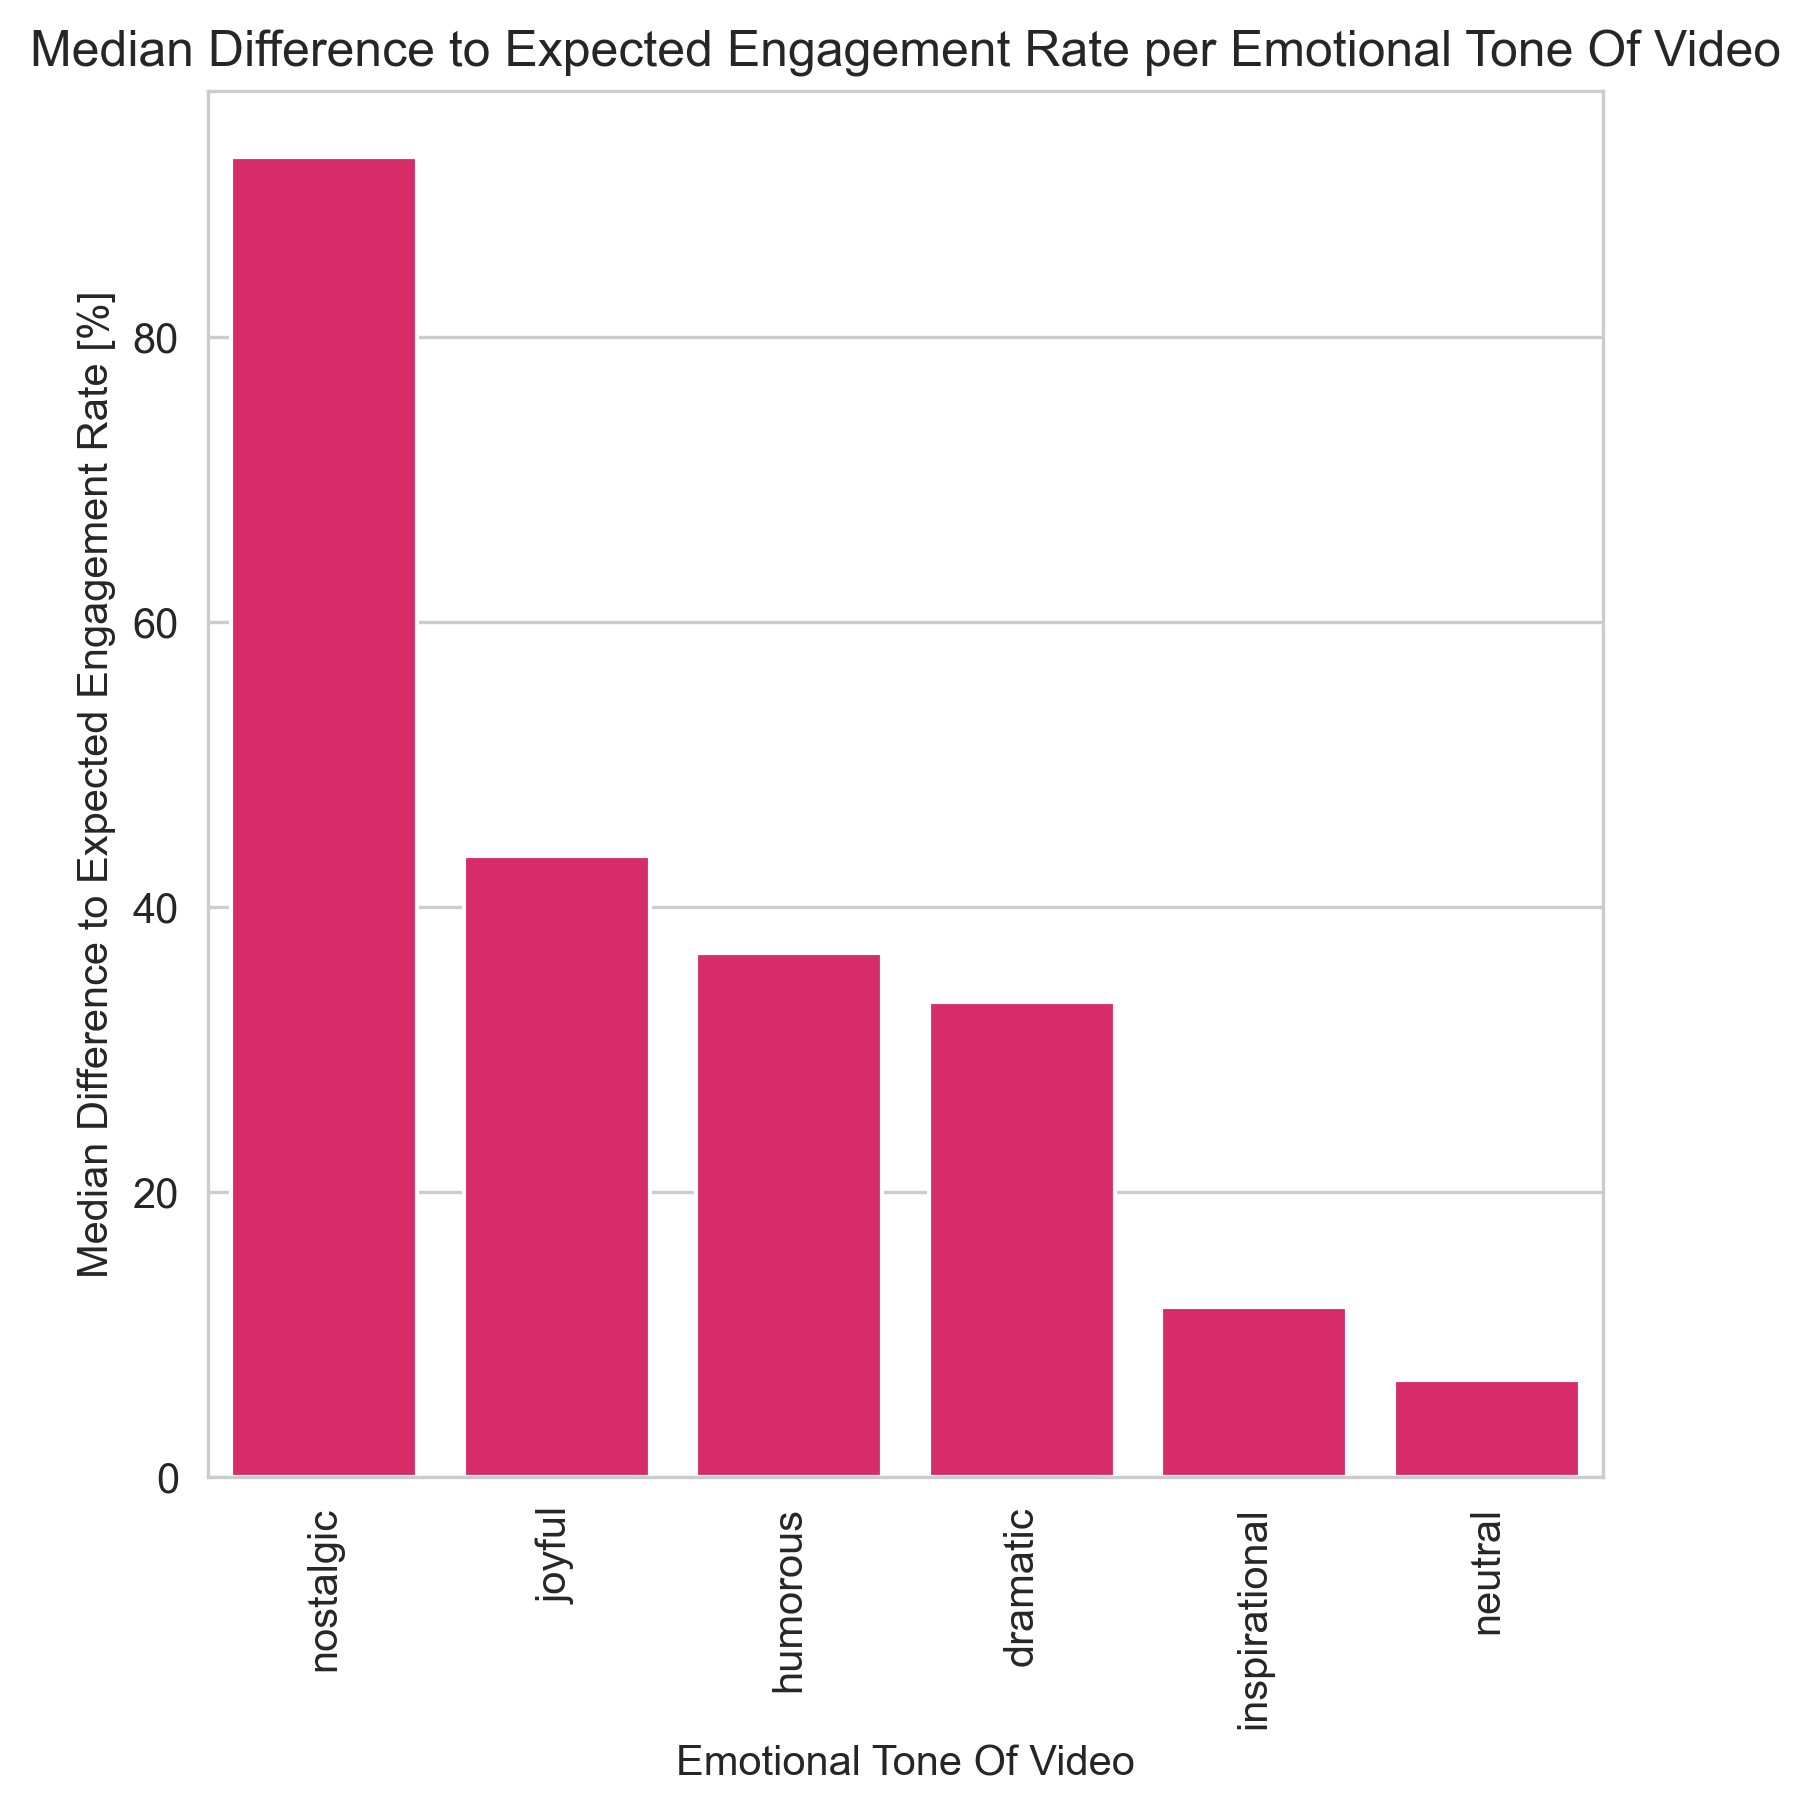
Emotional videos perform better. Neutrally toned videos perform poorly, as do "inspirational" videos. The people in the video should appear happy—thoughtful expressions drag engagement down. Almost half of all posted videos have no music.
Mixed-gender videos achieve the best engagement, which aligns with trends from group photos. Female-only videos perform significantly worse than male-only videos.
Videos with music (Trending, Mixes, Evergreens, Inspirational, Energetic) perform exceptionally well. In contrast, videos without music, romantic tracks, or relaxation music perform noticeably worse. Additionally, vocals in music significantly outperform instrumentals.
Recap
Successful LinkedIn engagement requires a strategic approach where quality matters more than quantity. Successful profiles post less frequently but use longer text on average compared to less successful ones.
A balanced content mix is key. Top-performing profiles prioritise images and galleries, while articles and documents/carousels are used less often.
Don’t be boring. For text posts, negative and positive tones outperform neutral ones. The best-performing formats include business updates, community impact stories, and personal anecdotes, while guides, facts, and whitepapers tend to underperform. Calls to action like "Comment," "Apply," or "Sign Up" are not recommended.
Authentic, people-focused, and positive visuals are essential. Image and gallery posts should feature people, especially group photos with 20 or more individuals, and contain no text overlays. Videos are most effective when they feature four or more people, ideally 20+, have no captions, and convey strong emotions with happy people and trending music.
Deepening connections is crucial as LinkedIn is not a lead generation or recruitment platform. People-focused content drives high engagement. Employees and current customers generate the best results, while job seekers and broader audiences underperform. A celebratory and exciting tone works best, while provocative or controversial content should be avoided.
Experimenting and optimising is essential. The study highlights that content type, tone, audience, use of images/videos, and CTAs all play a crucial role in engagement. Follower count impacts engagement rates significantly, so successful profiles take a structured approach to optimising their strategy.
More Insights?
Do you want a detailed industry analysis or compare your LinkedIn Business Page’s performance against your competitors? What are they doing better than you? Then check out our Benchmark Reports: